Gradle Technologies is now Develocity — read the announcement

Artifact Cache

Download dependencies once. Serve them from the LAN every build after.

Dependency Caching dashboard showing 95.7% of dependency volume served from the Develocity Edge.

Feature overview

Artifact Cache

Before a build runs, Artifact Cache restores its dependencies and build inputs from the Develocity Edge. Dependencies dominate the download volume, with toolchains, build-tool wrappers, and analyzer binaries like SonarScanner making up the rest. That stops ephemeral CI agents from re-downloading the same artifacts from remote repositories on every run, consuming 20–40% of total build time at large enterprises. It runs as CI pre- and post-steps, leaving the build untouched. Over 95% of artifacts come from the cache, and only new versions reach upstream repositories. It is the artifact-resolution layer of the Universal Cache product line.

Dependencies resolve at LAN speed, right next to your CI agents

  • Edge nodes sit next to your CI agents and serve over 95% of dependencies, cutting WAN egress and repository load by the same margin.
  • Collapse per-dependency round-trip overhead with efficient streaming of entire dependency trees using HTTP/2 multiplexing.
  • Insulate builds from repository instability. Develocity Edge keeps serving cached dependencies even when the upstream is throttled, slow, or unavailable.
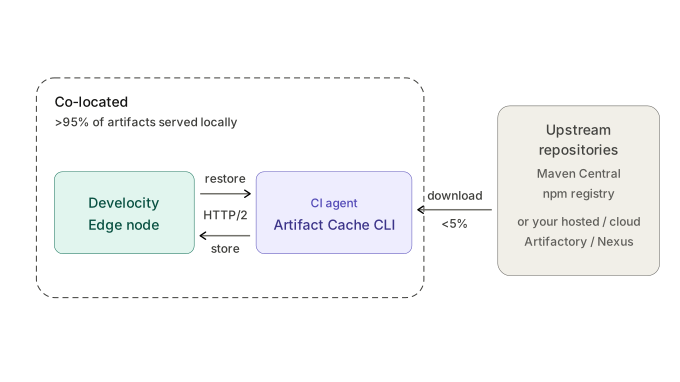
Topology diagram showing a Develocity Edge node co-located with the CI agent in the same zone. The Edge serves over 95% of dependencies locally at LAN speed over HTTP/2. The remaining under 5% is downloaded from upstream repositories — Maven Central, npm, and hosted or cloud-managed Artifactory and Nexus instances — over the WAN.

One artifact, one object

  • Less to upload and store per change. A changed dependency becomes one new object, whereas blob caches re-pack the whole multi-gigabyte directory.
  • Pull only what your CI job needs. Each restore is scoped to that job's dependency set, with shared dependencies cached once across jobs.
  • Coarse-grained caches force a size-retention-cost tradeoff. Fine-grained storage holds each artifact once across the CI runner pool, breaking the tradeoff.
Build Scan Performance > Network Activity view showing only a few GET requests during build execution. Artifact Cache had already restored the dependencies before the build started, leaving almost no network activity for the build to perform.

Adopt centrally, with no build-script changes

  • A standalone Java CLI runs as CI pre- and post-steps; the build tool is untouched and no repo opts in by editing build logic.
  • CI-agnostic across Jenkins, GitHub Actions, GitLab, TeamCity, and custom runners — one Edge backend serves any mix.
  • Coverage extends to analyzer binaries like SonarScanner, not just dependencies and toolchains.
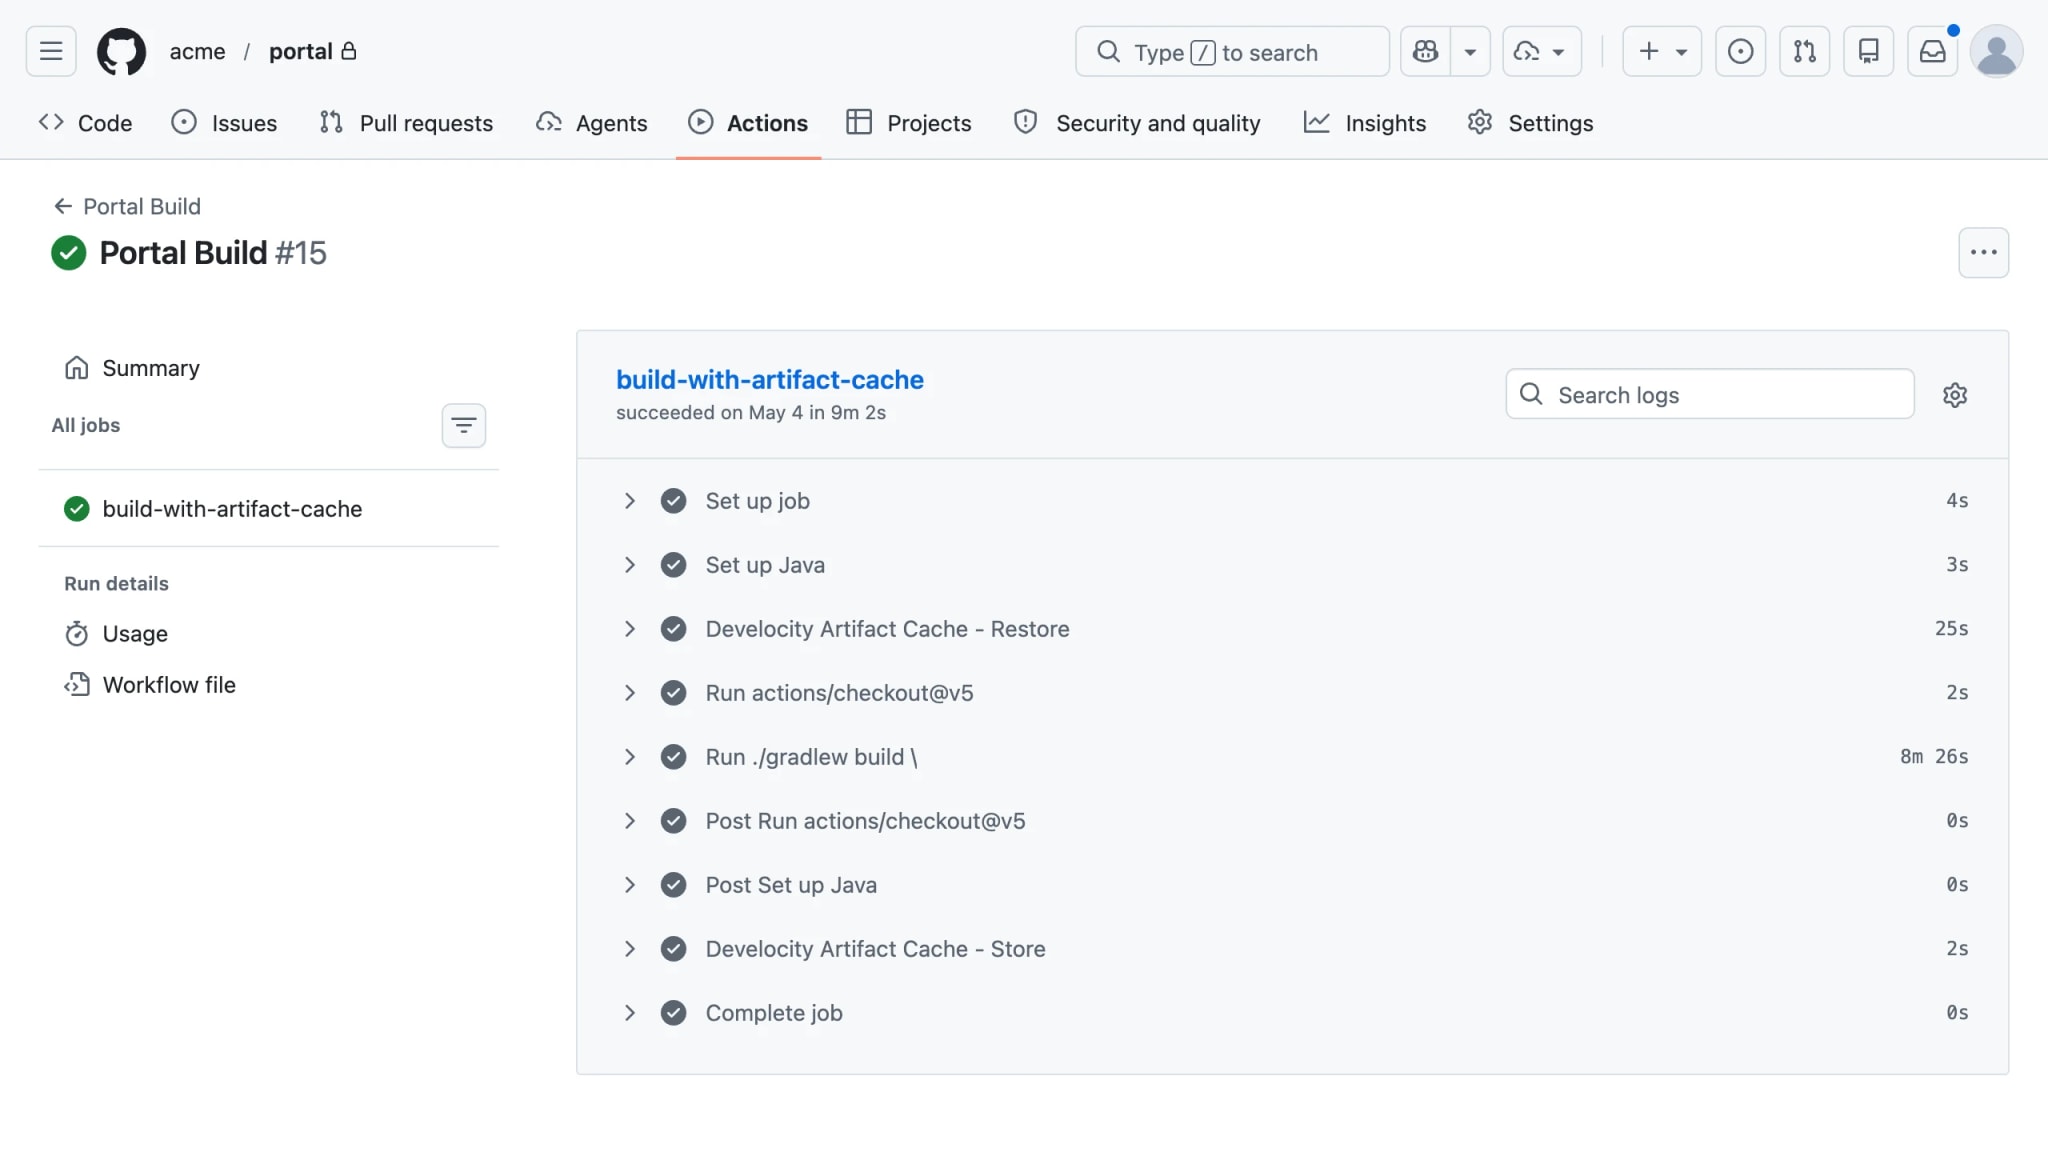
GitHub Actions job log showing Develocity Artifact Cache Restore and Store steps wrapping an unmodified Gradle build.
Observability

See exactly what resolved, from where, in any build

  • Open any Build Scan to see every dependency a build resolved, where it came from, what failed, and how long it took.
  • Pivot from one slow dependency download to every build hitting the same upstream repository in the Observability Data Platform, so the pattern emerges across the organization.
  • Rank the upstream repositories, dependency groups, or build steps that cost the most time and bandwidth, so the highest-ROI fixes surface first.
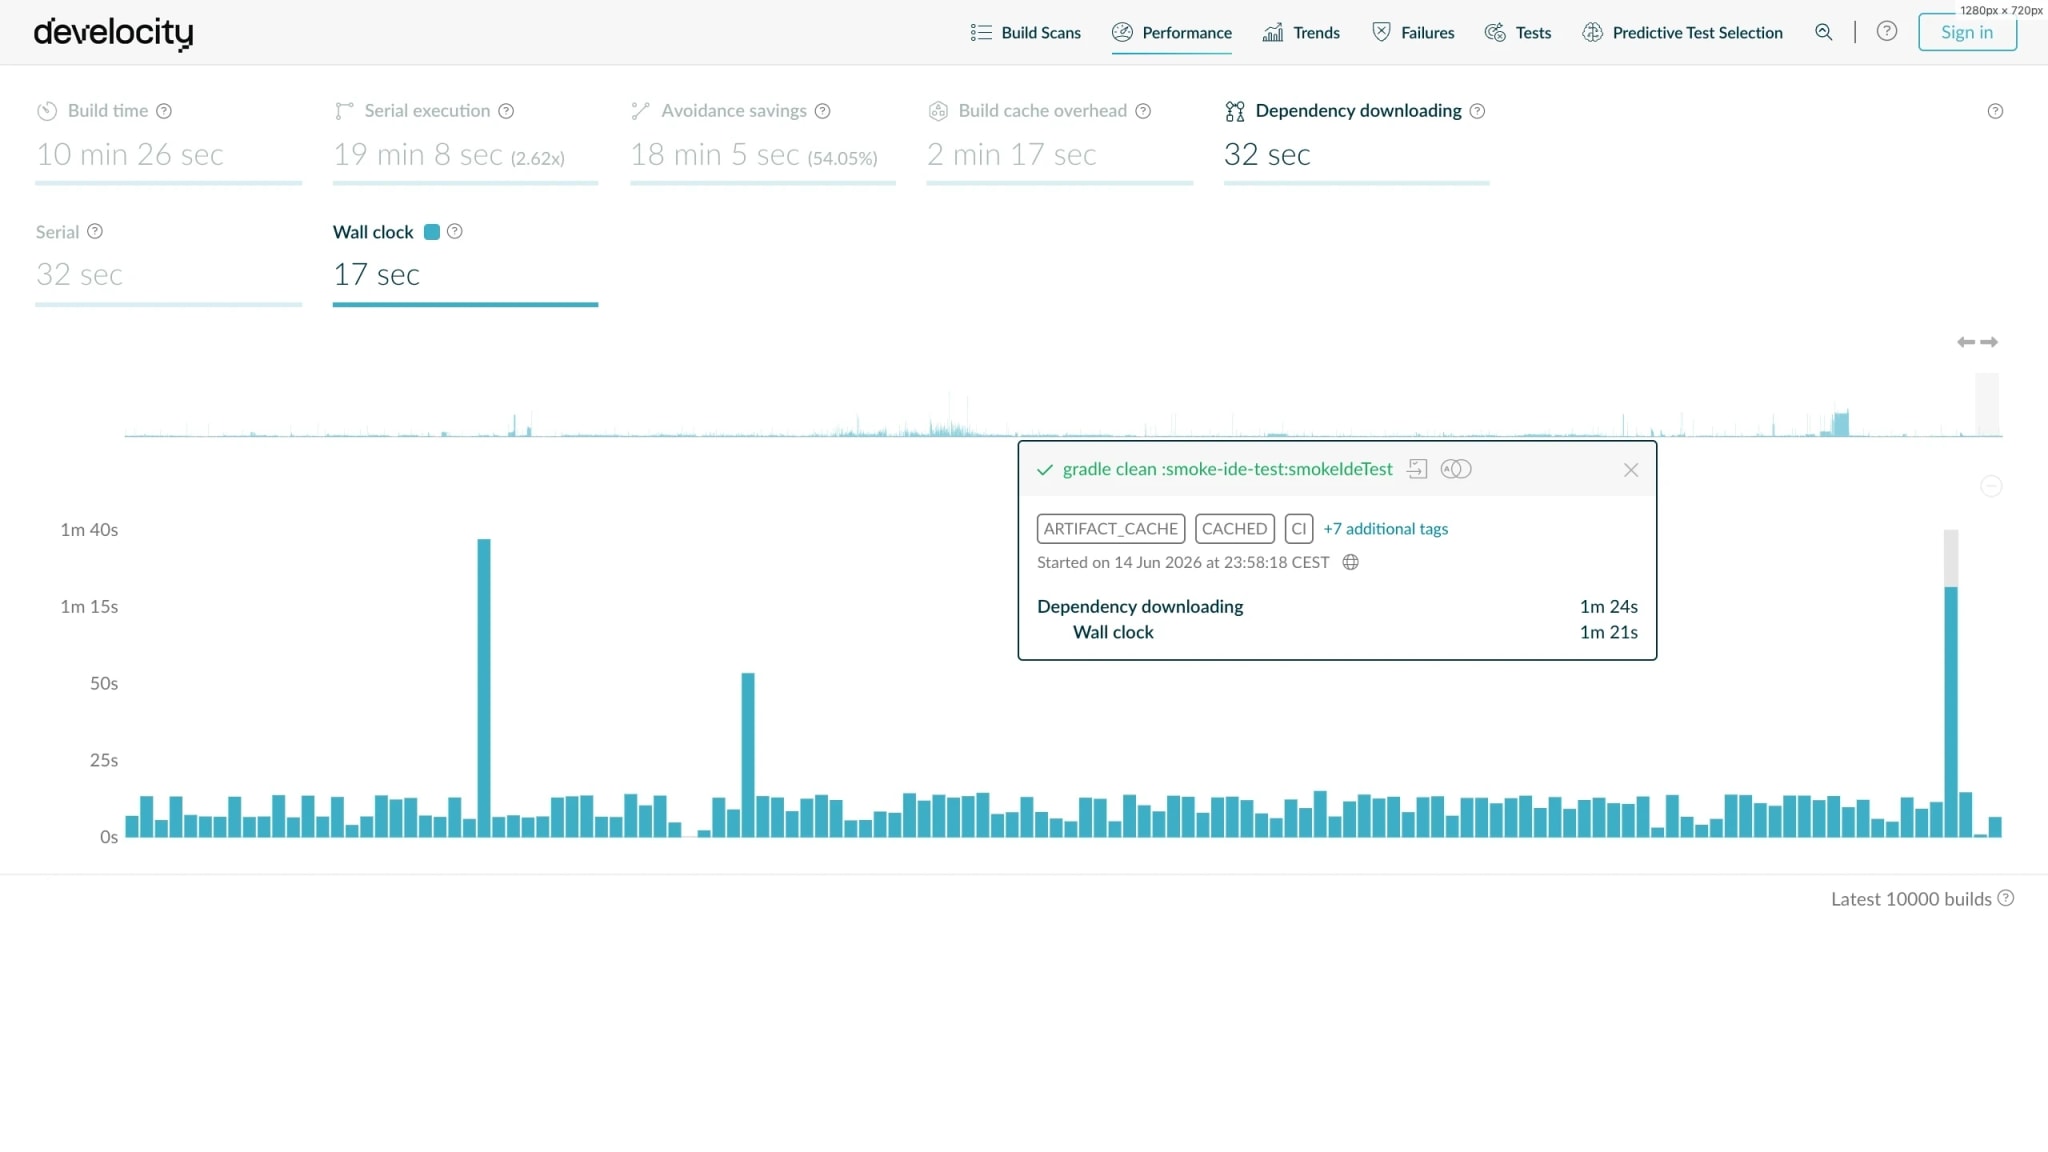
Observability Data Platform Performance dashboard plotting wall-clock dependency download time per Build Scan, making it easy to confirm the system is healthy and to pinpoint outliers that warrant investigation.
Analytics

Project the cache-hit rate, then measure it

  • Project the hit rate before rollout with Develocity Analytics. What your builds resolve today shows how much would come from the cache.
  • Measure the actual hit rate per build tool and project, so wins and gaps are attributable, not aggregate.
  • Pinpoint the upstream repositories that slow or break builds. Per-repository data on download latency and failures quantifies how much instability the cache absorbs.
Develocity Analytics Repository Stability dashboard showing download failures grouped by repository and failure category, helping teams assess which upstream repositories are causing build slowdowns and failures.
Governance

Know where every dependency came from

  • Carry each artifact's origin metadata through every restore, so ephemeral CI agents inherit provenance instead of starting blank.
  • Surface the direct-internet downloads that slip past your repository firewall, so you can close the supply-chain gaps opaque caches hide.
  • RoadmapPrevent untrusted artifacts from entering the supply chain.
Build Scan Dependencies view showing the org.slf4j:log4j-over-slf4j dependency with its download origin recorded as Maven Central, demonstrating how Artifact Cache preserves per-dependency provenance across every build.

Resources

Universal Cache: fast, reliable, and cheap CI pipelines (DPE Summit 2025)
Video
When AI code overloads CI, Universal Cache keeps builds fast and costs in control
Blog
The Build Artifact CDN: strategic infrastructure for AI-driven DevOps
Blog
Why pipeline acceleration is now a strategic imperative in the GenAI era
Blog

What's next

Get started today with a 30-day free trial of the entire Develocity product suite.

Start Free Trial

© 2026 Gradle, Inc. Gradle®, Develocity®, Build Scan®, and the Gradlephant logo are registered trademarks of Gradle, Inc.

Get an AI summary of Develocity: