Gradle Technologies is now Develocity — read the announcement

Metadata Enrichment

Know where every build ran and what triggered it — CI, IDE, or AI agent — captured automatically on every Build Scan.

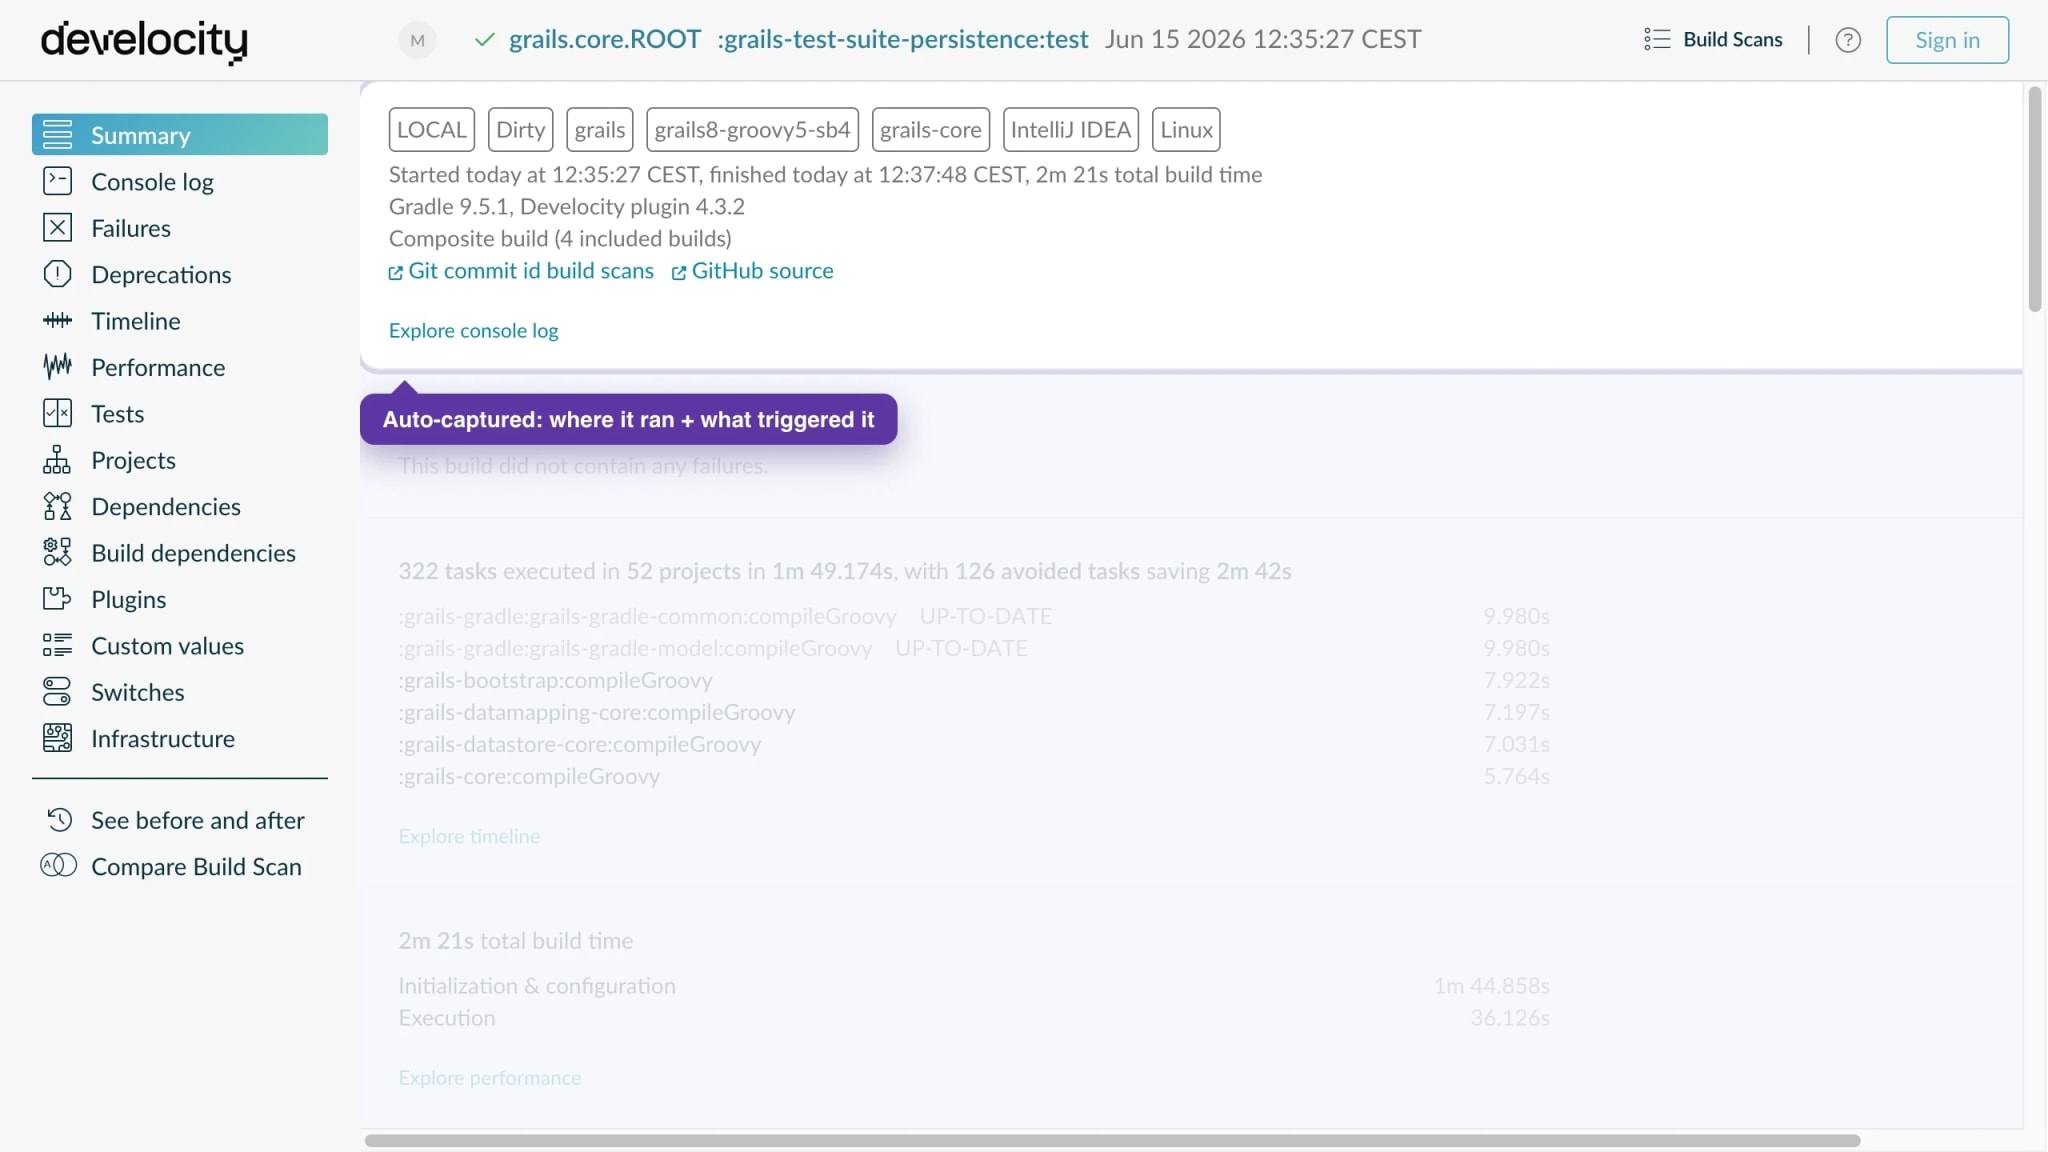
Build Scan showing CI, git, IDE, AI-agent origin, and an organization-specific custom value on a single build.

Feature overview

Metadata Enrichment

Every Build Scan captures a rich record by default. Metadata Enrichment adds the context it doesn't — where a build ran and what triggered it, whether from CI, an IDE, or an AI agent. For that most-wanted context, the Common Custom User Data plugins detect and attach it automatically, alongside Develocity; for anything specific to your organization, like a project's business unit, you add it through the build tool's Build Scan API as custom tags, values, and links. Either way it lands on the build's own Build Scan as the build runs. Whatever a Build Scan holds is then persisted, searchable, and groupable in the Observability Data Platform, feeding the trends and analytics Develocity Analytics surfaces for people and AI agents alike.

Every build carries the context of where it ran and what triggered it — captured automatically

  • The Common Custom User Data plugins apply alongside Develocity, no code to write.
  • As the build runs it reads CI variables, IDE system properties, AI-agent markers, and git state — landing them on the Build Scan as tags, values, and links.
  • The plugins pre-implement the most-wanted context on the generic Build Scan API — and you add your own, like a project's business unit, through the same API.
  • Build logic stays untouched, and because the data lives on the build record, every downstream query, dashboard, and policy can filter and group by it.
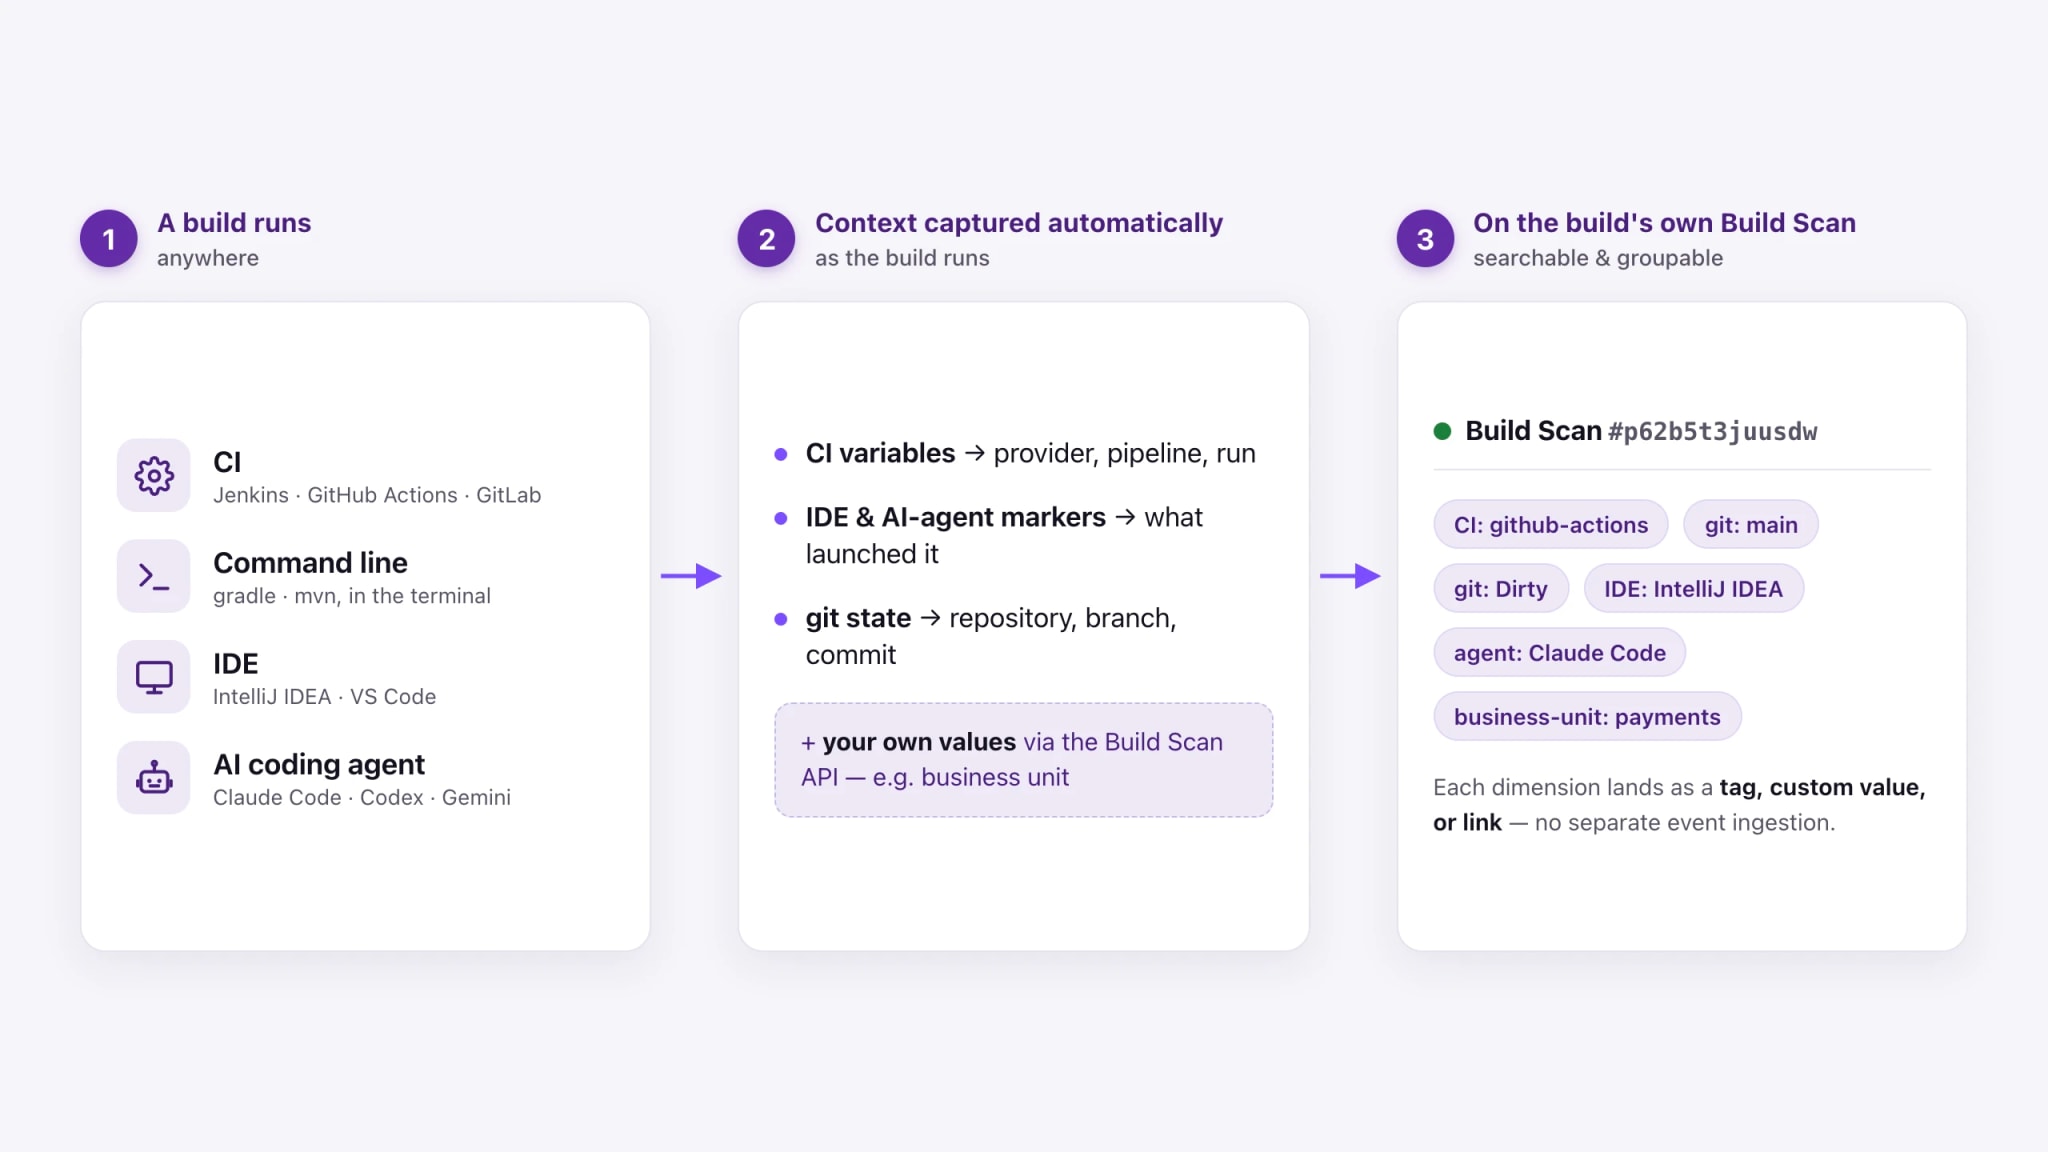
Enrichment flow — CI, git, origin, and custom values attached to the build's own Build Scan.

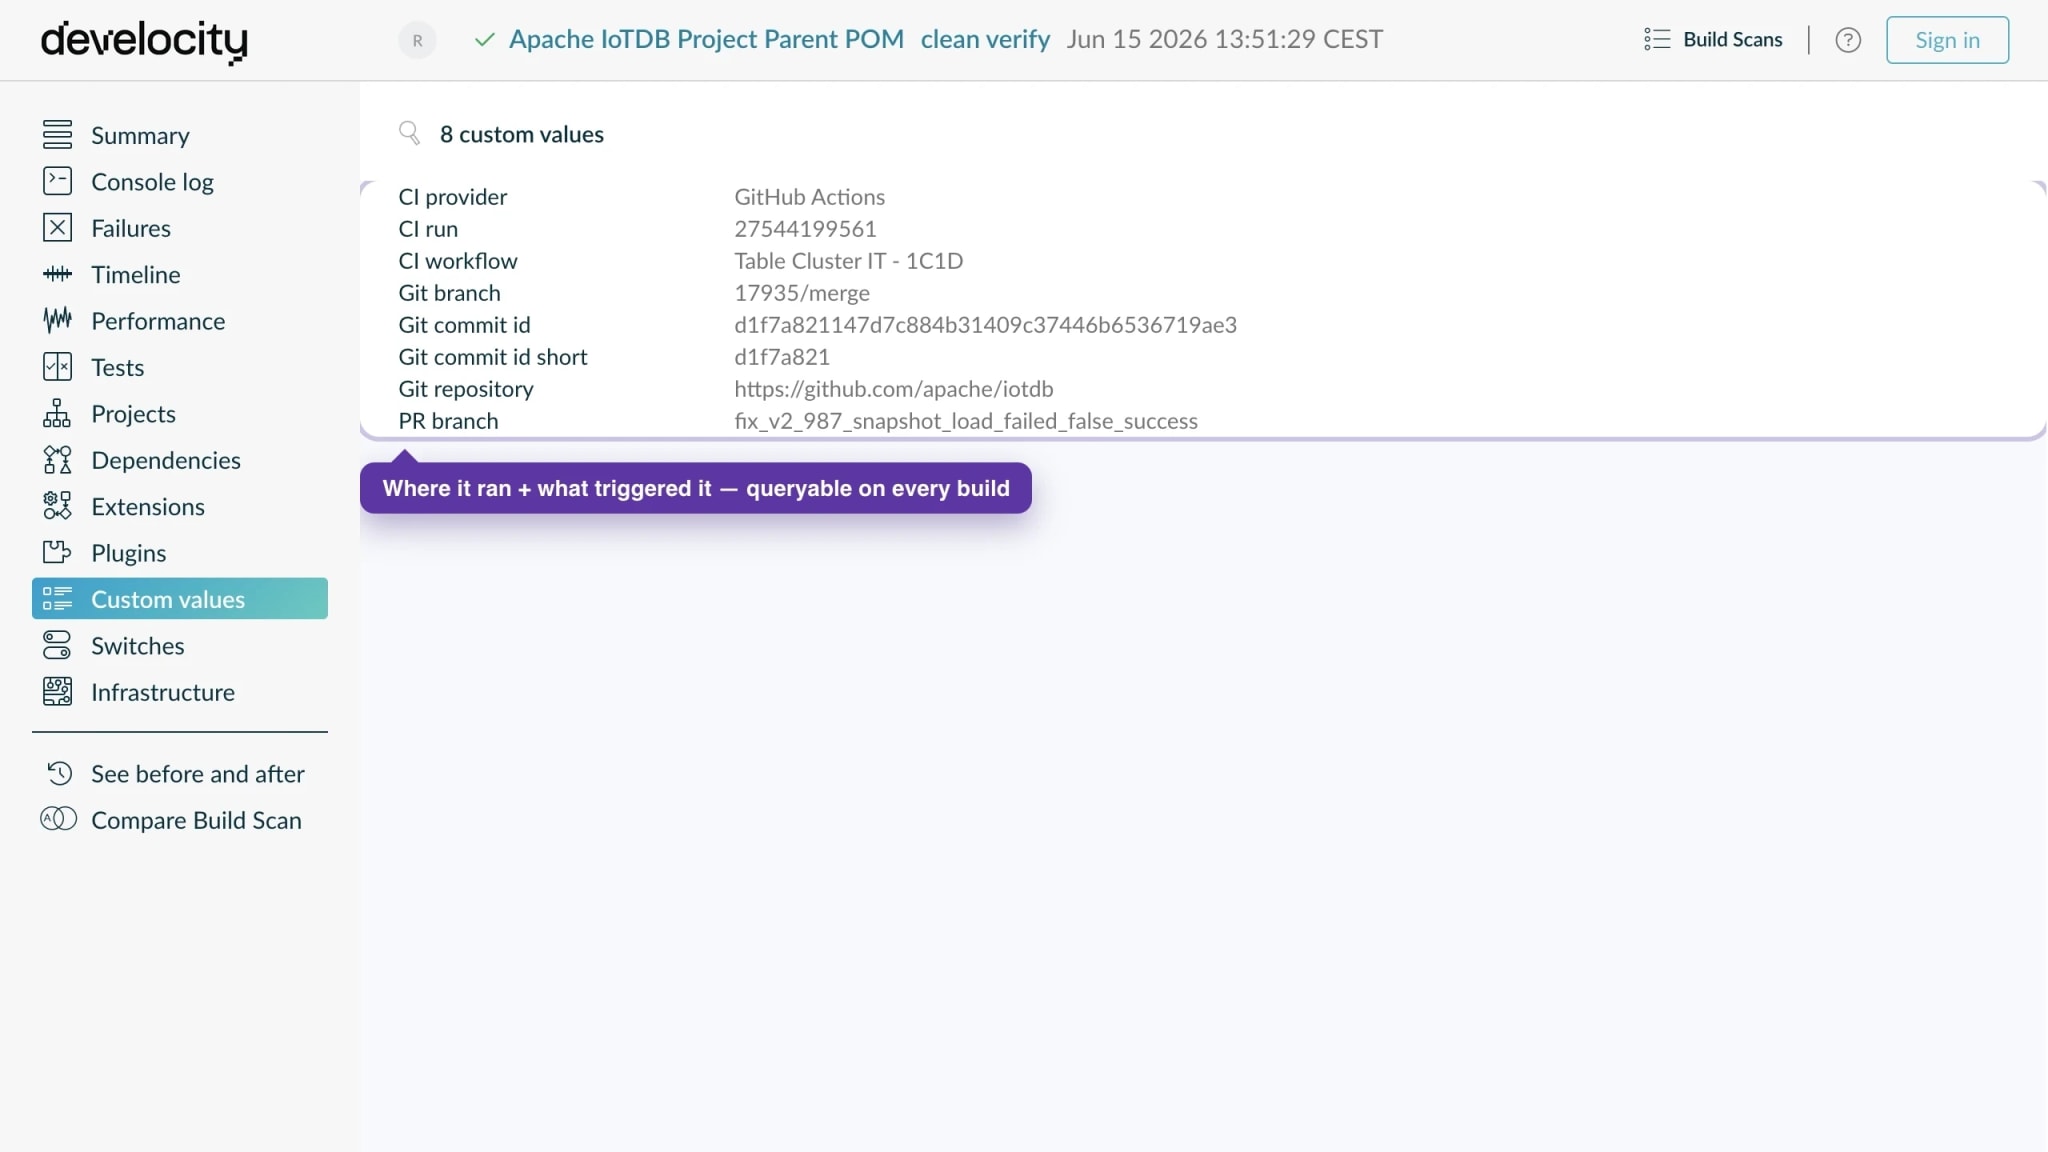
Know where every build ran — the CI system, pipeline, and source behind it

  • Every CI build carries its provider, pipeline, and run — across Jenkins, GitHub Actions, GitLab, CircleCI, TeamCity, Azure Pipelines, Travis, Buildkite, and more.
  • Pin every build to its source — repository, branch, and commit, with uncommitted changes flagged and the base branch recorded on pull-request builds.
  • Resolve straight to GitHub or GitLab — open the exact revision, pull request, or CI run behind any build in one click.
Build Scan carrying CI provider, pipeline, run, and git repository, branch, and commit.

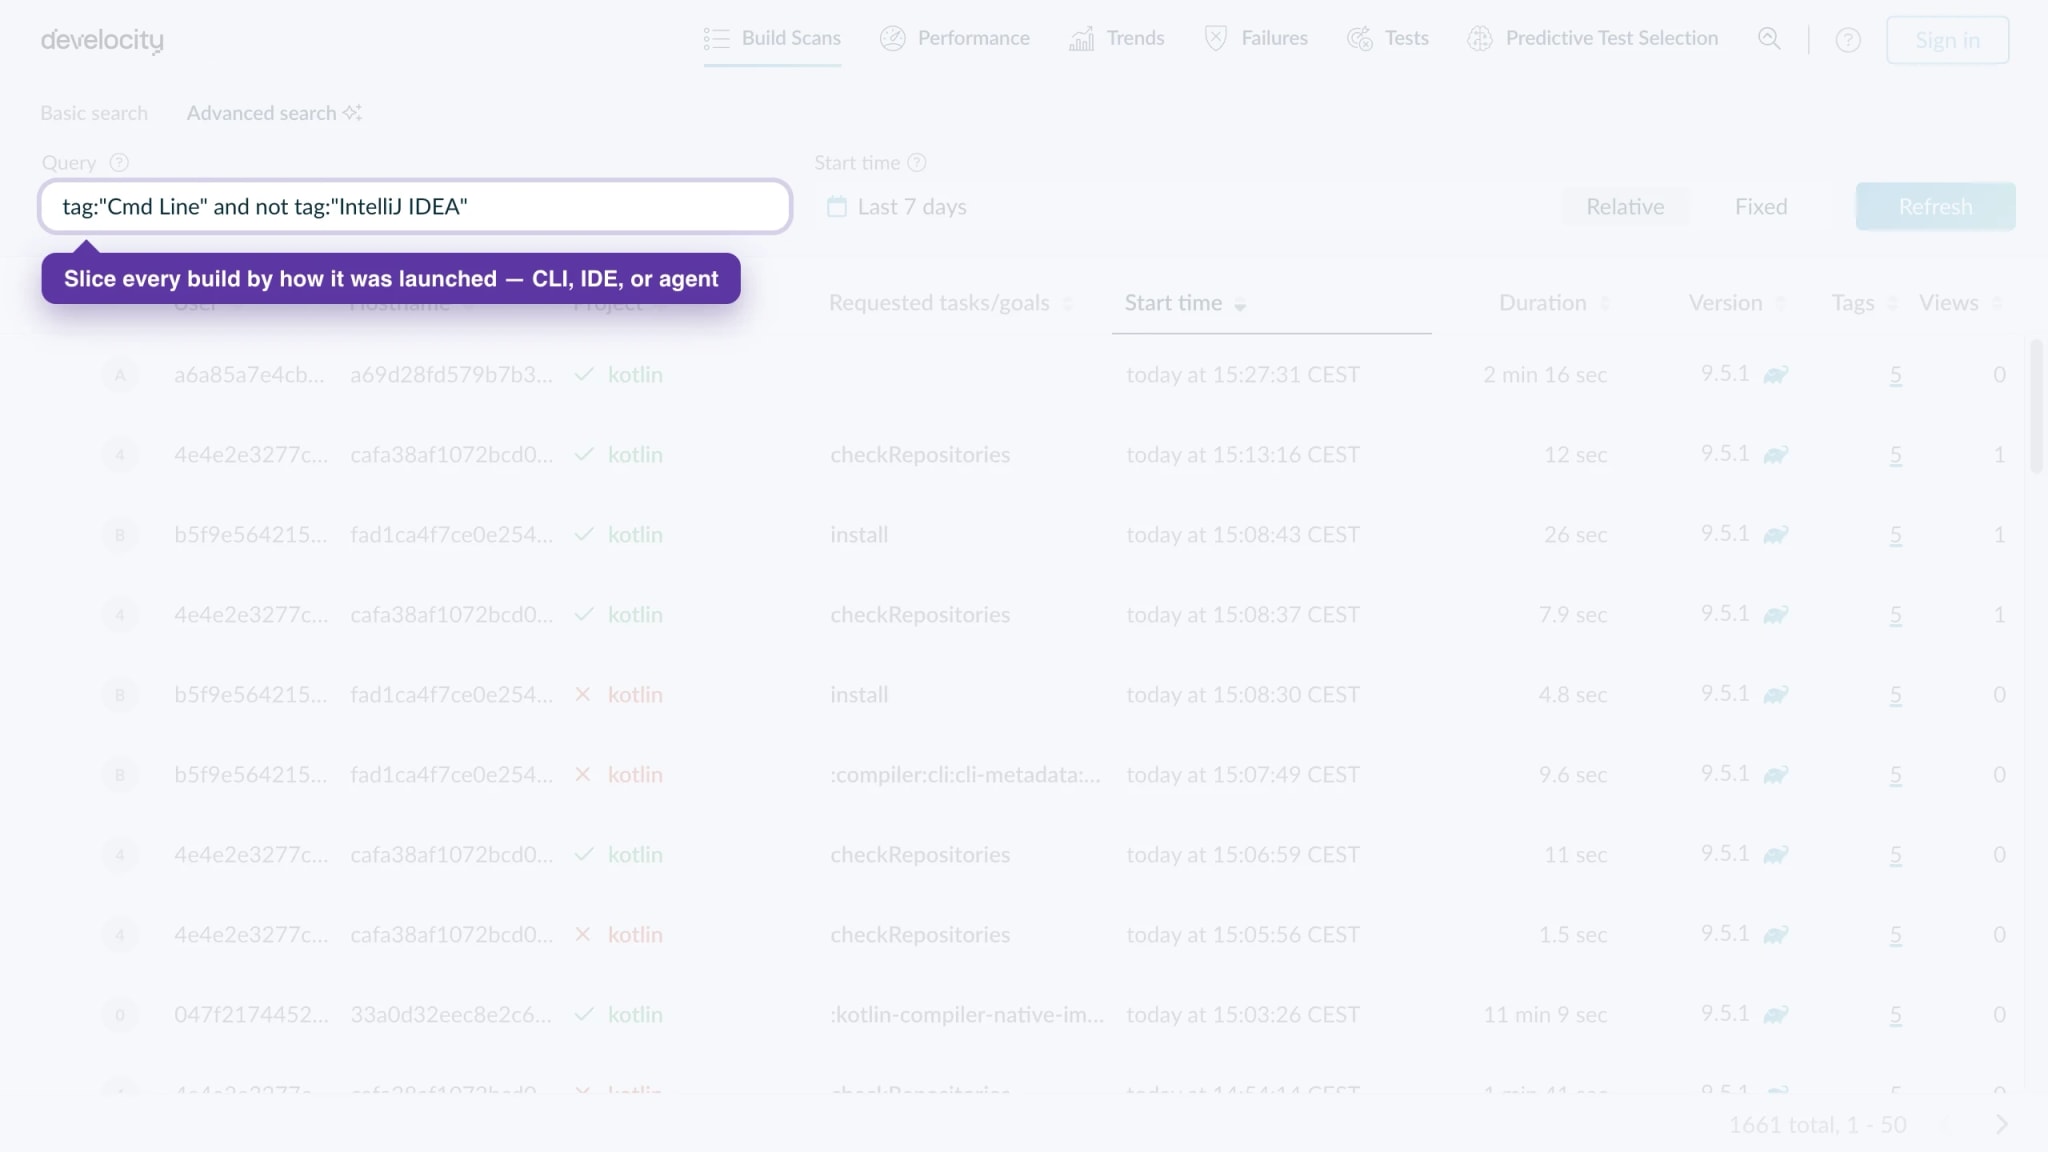
Tell command-line builds from IDE-driven ones, and see which IDE

  • Builds run on a developer machine are distinguished from CI ones, and IDE-launched builds name the IDE — IntelliJ IDEA, Android Studio, Eclipse, or VS Code.
  • Tell interactive IDE sessions apart from plain terminal runs, and see the developer inner loop directly.
  • Give IDE sessions their own performance baseline, so they don't skew command-line or CI timings.
  • This is origin attribution, not IDE instrumentation — it records where a build was launched, independent of the Develocity IDE plugins themselves.
Build Scan list separating command-line local builds from IDE-driven builds.

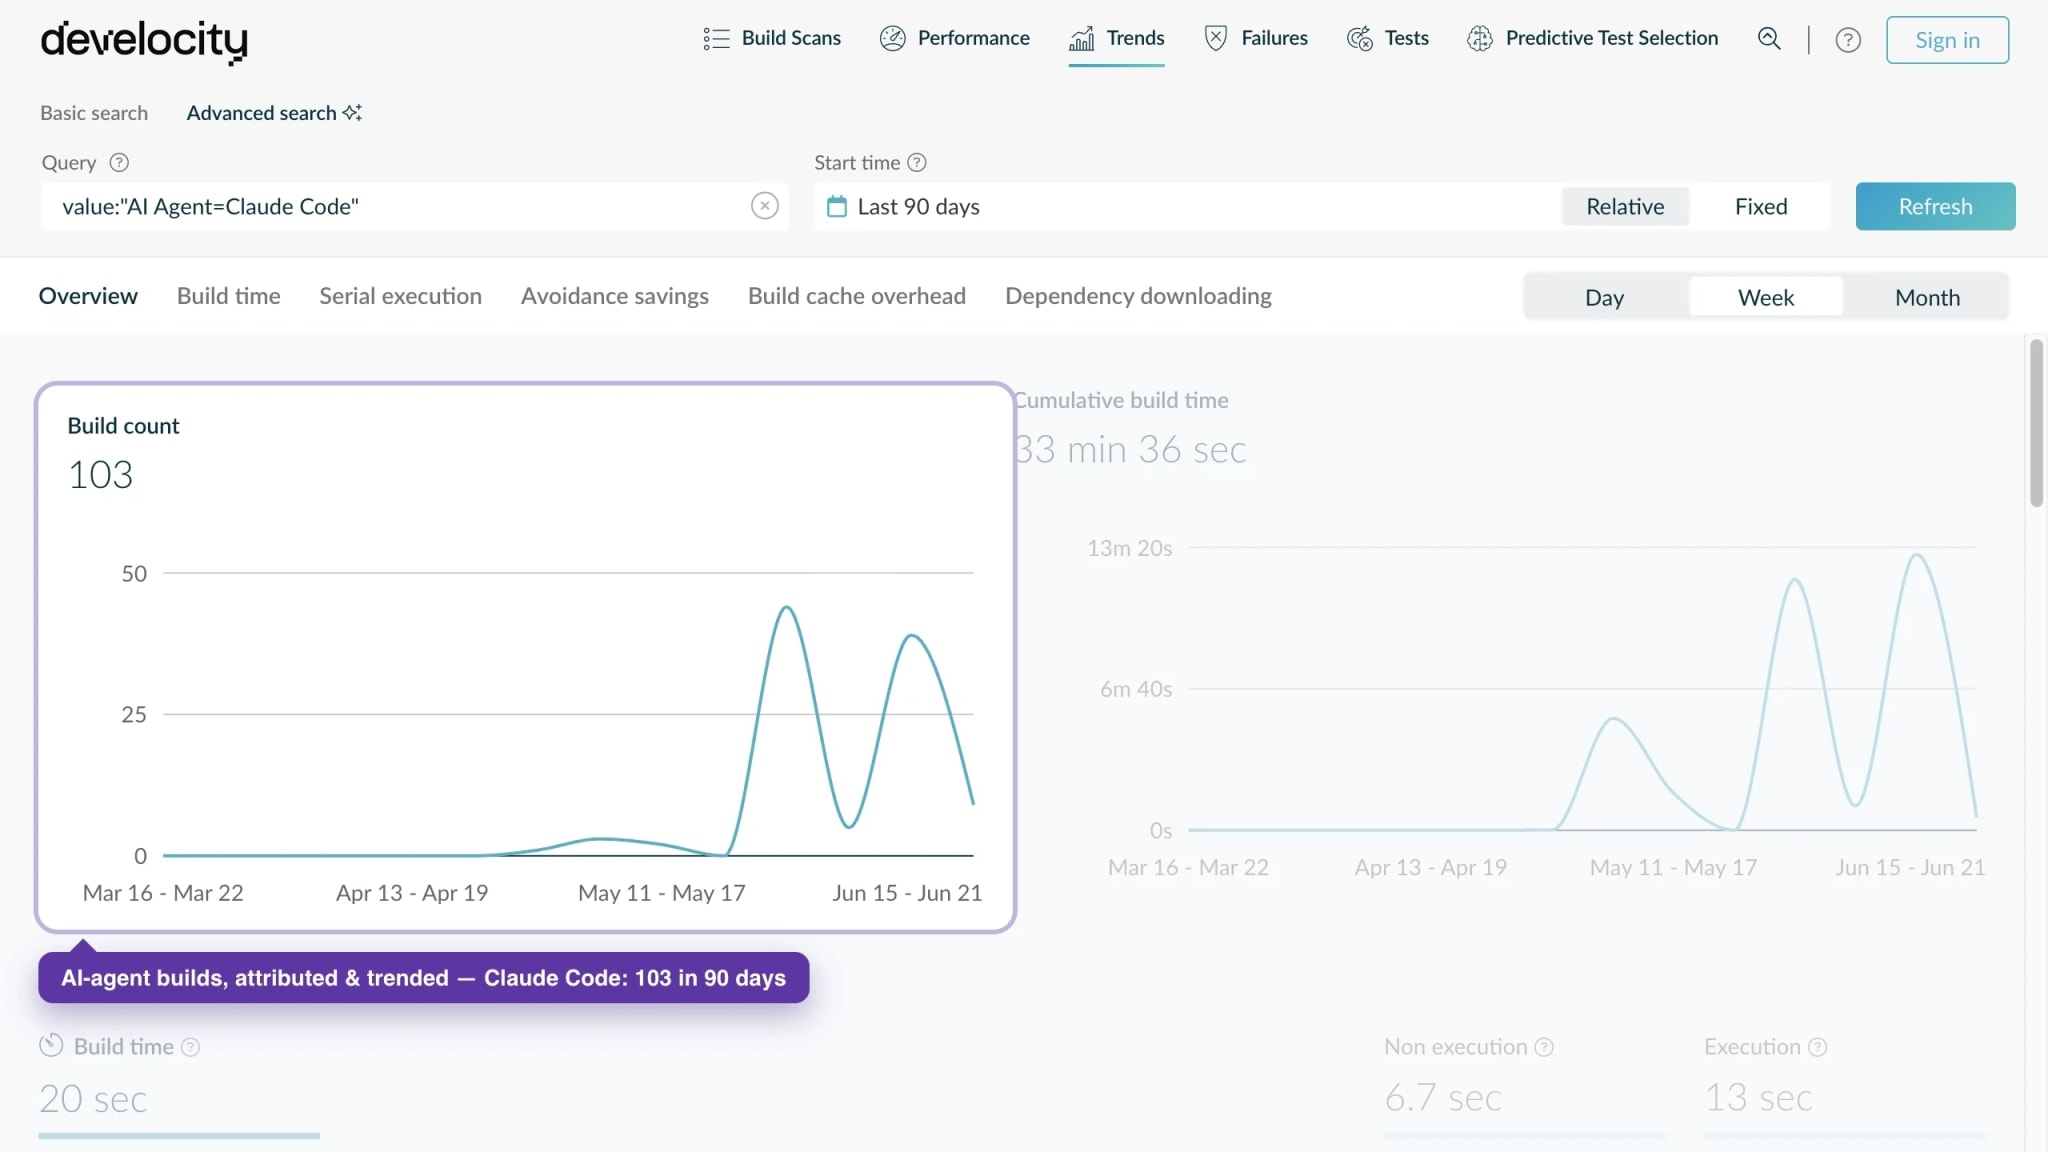
Attribute every build to the AI agent that triggered it

  • Builds triggered through an AI agent are attributed to it, with the agent named — Claude Code, Codex, OpenCode, Gemini CLI, or Gemini in Android Studio.
  • This applies wherever an agent runs the build — on a developer machine or in CI — so agent-driven work is visible across the inner loop and the pipeline alike.
  • Agent-driven work becomes distinguishable from human-authored work on the same dashboards, with no extra setup.
  • Measure an agent's real impact on the build — compare failure rates, build times, and rework between agent-driven and human-driven builds.
Develocity Trends showing builds attributed to the Claude Code AI agent, trended over 90 days.
Observability

Filter, compare, and trend every build by where it came from

  • Everything you enrich — origin, environment, and your own custom data — lands as Build Scan tags, values, and links, queryable on any individual build.
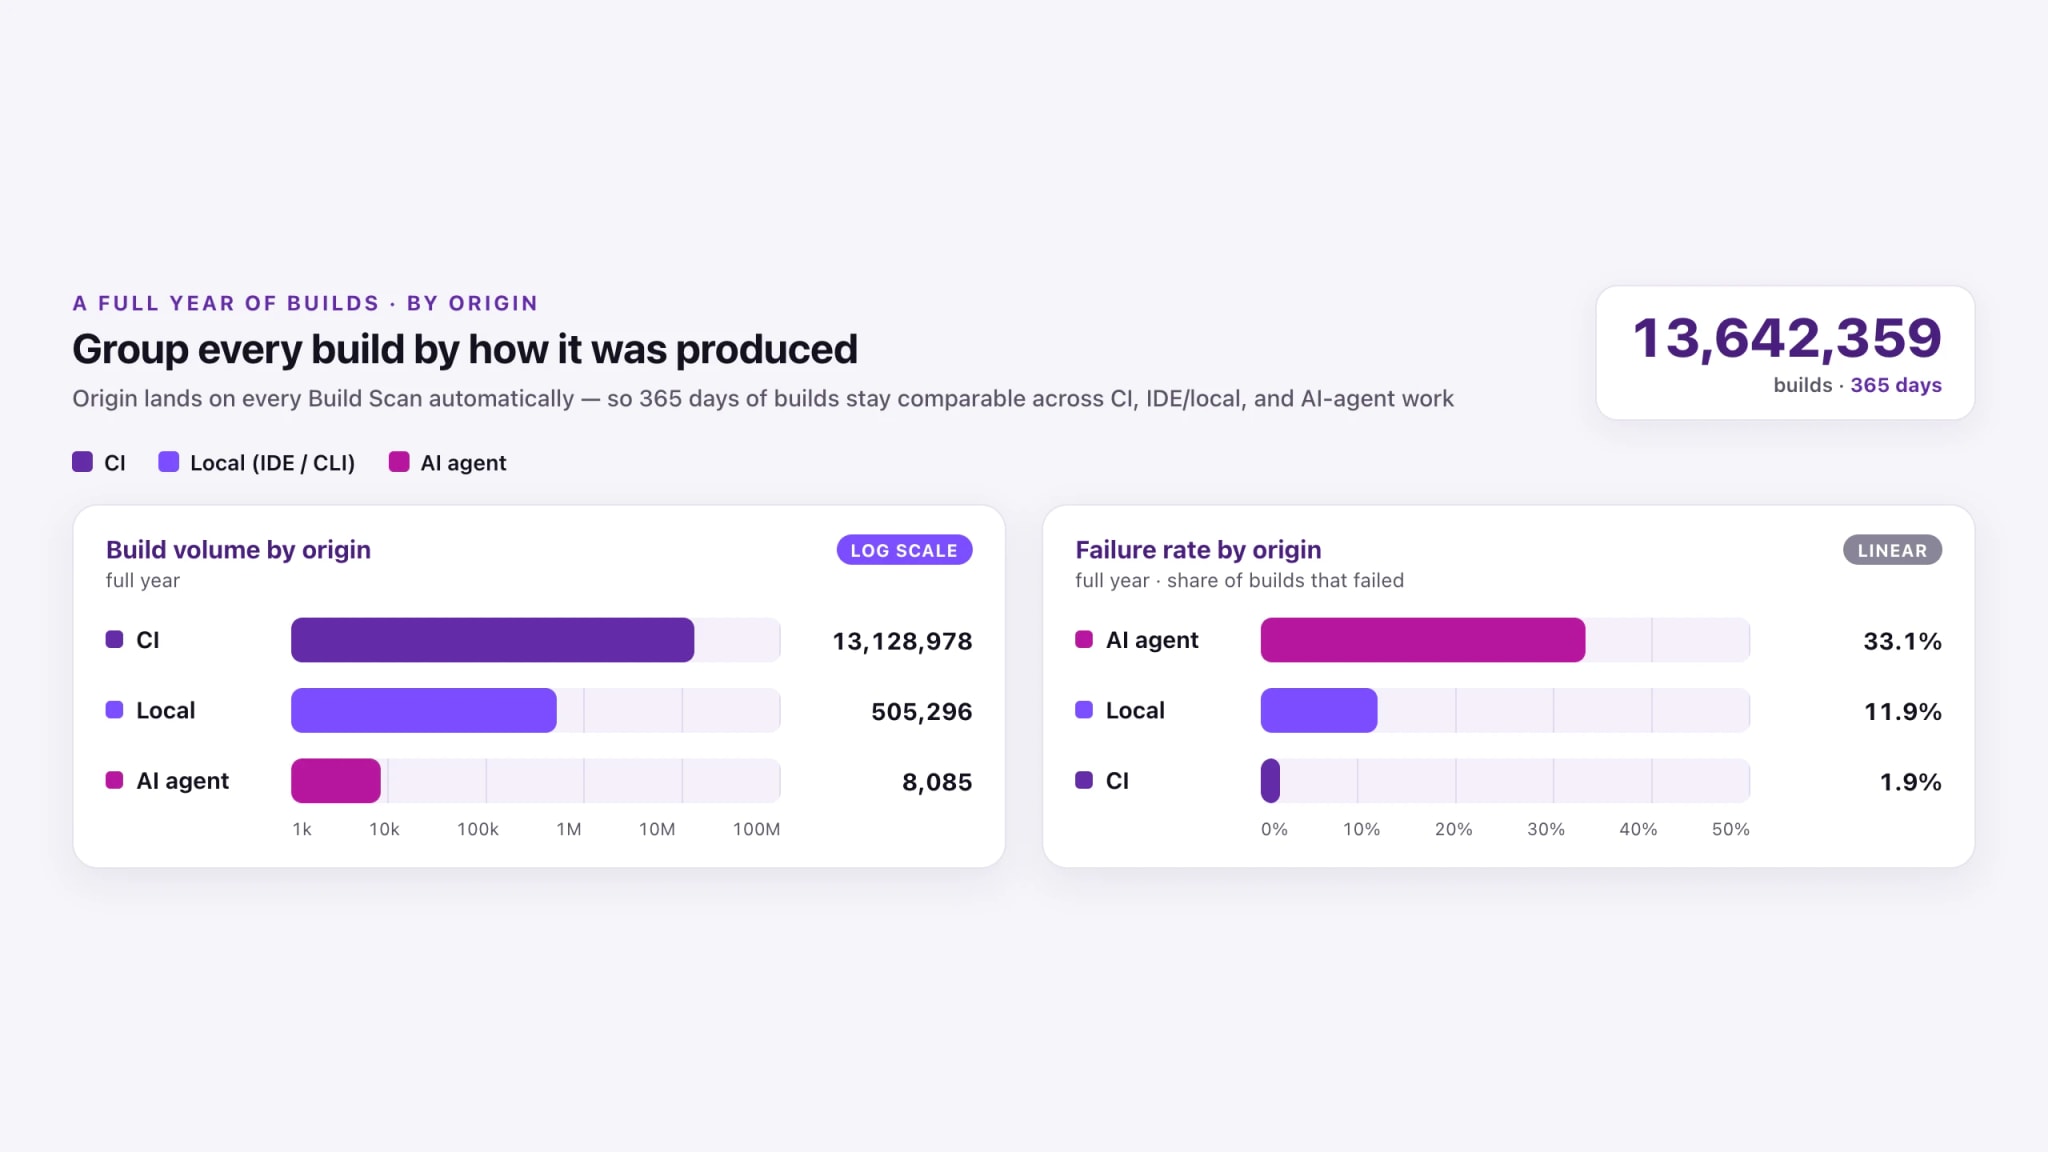
  • Develocity Analytics aggregates it across every project — slice and trend failure rate, duration, and volume by how a build was produced: CI, command line, IDE, or agent.
  • Because enrichment lives on the same record as the build's telemetry, you correlate it with cache hits, timings, and failures in one query — not a separate log join.
  • AI agents reach the same enriched Build Scans through Develocity's MCP servers — a build's origin, environment, and custom data, in the context an agent reasons over.
A full year of builds grouped by origin (CI, local, AI agent), comparing build volume and failure rate across groups.

Resources

Introducing Develocity 360: Toolchain Observability
Blog
Your toolchain IS production: why observability is non-negotiable
Blog
Build is a process, not an action
Blog

What's next

Get started today with a 30-day free trial of the entire Develocity product suite.

Start Free Trial

© 2026 Gradle, Inc. Gradle®, Develocity®, Build Scan®, and the Gradlephant logo are registered trademarks of Gradle, Inc.

Get an AI summary of Develocity: