Gradle Technologies is now Develocity — read the announcement

Develocity Analytics

Query every build in your organization — not one at a time.

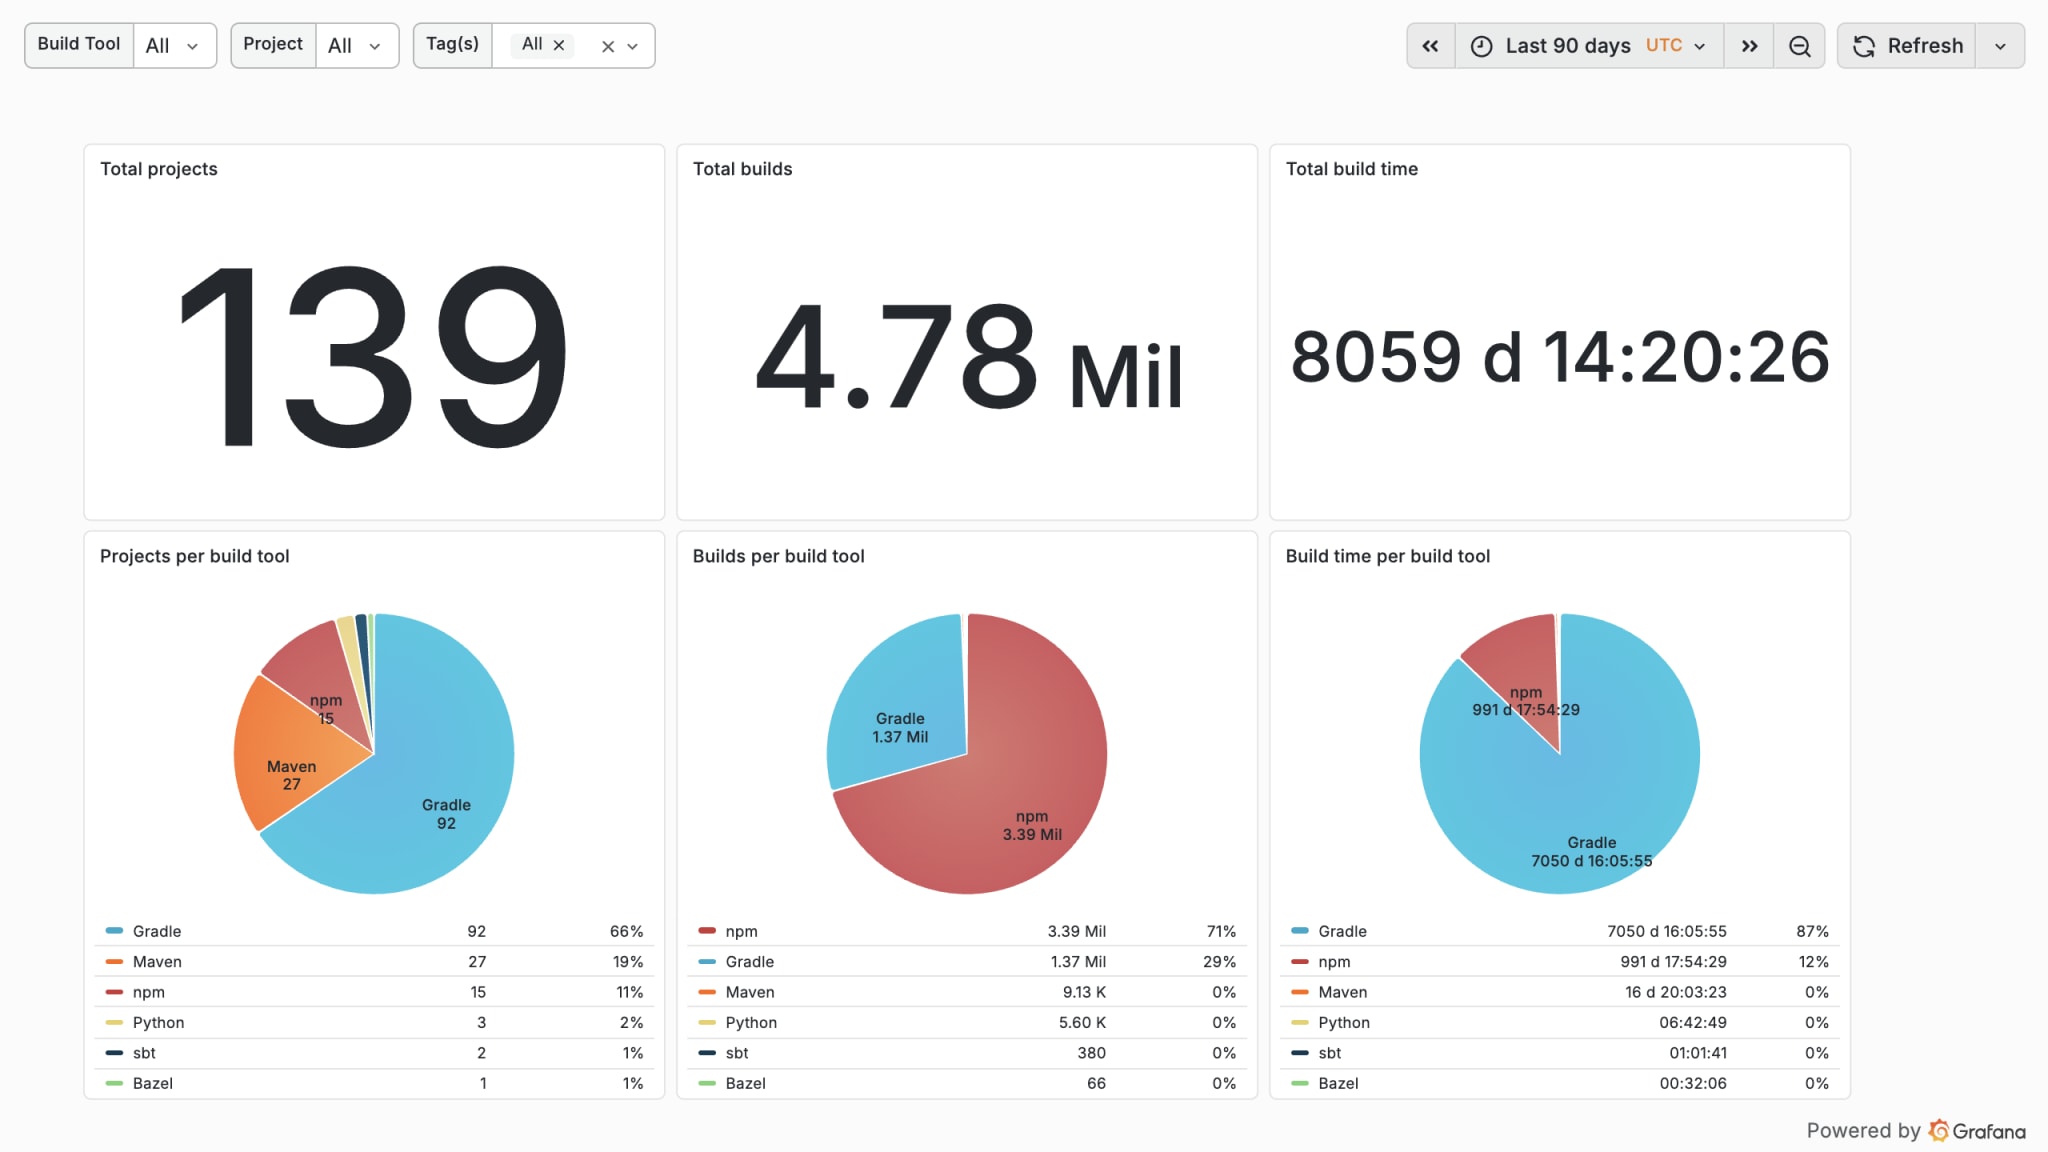
Develocity Analytics Global Volume dashboard over a 90-day window — 139 projects, 4.77 million builds, 8,052 days of cumulative build time, with per-build-tool breakdowns.

Feature overview

Develocity Analytics

Develocity Analytics is the platform's cross-build SQL layer. Every Build Scan Develocity captures is exported continuously into columnar storage — via the self-hosted Develocity Reporting Kit or the cloud-native AWS Athena/S3 pipeline. Query it through pre-built Grafana dashboards, any SQL-compatible BI tool, or a Model Context Protocol (MCP) server for AI agents. The build schema is pre-modeled — based on Develocity's API contract — so there is no customer-side ETL or schema design; it ships with a library of dashboards covering build performance, failure analysis, build acceleration, toolchain compliance, and dependency health.

Query your entire build history as one SQL dataset

  • See trends across millions of builds — columnar storage exposes every build Develocity captured, queryable via a standard SQL interface (Reporting Kit) or AWS Athena.
  • Gradle's own production instance holds millions of builds — over 21 years of cumulative build time, all queryable from a single place.
  • Deploy to fit your environment — the self-hosted Develocity Reporting Kit for regulated and air-gapped environments, or the cloud-native AWS Athena/S3 pipeline; the same dashboards work on both.
  • Bring your own BI stack — point Tableau, Looker, or any SQL client at the same data; bundled dashboards ship with their SQL open to copy and adapt.
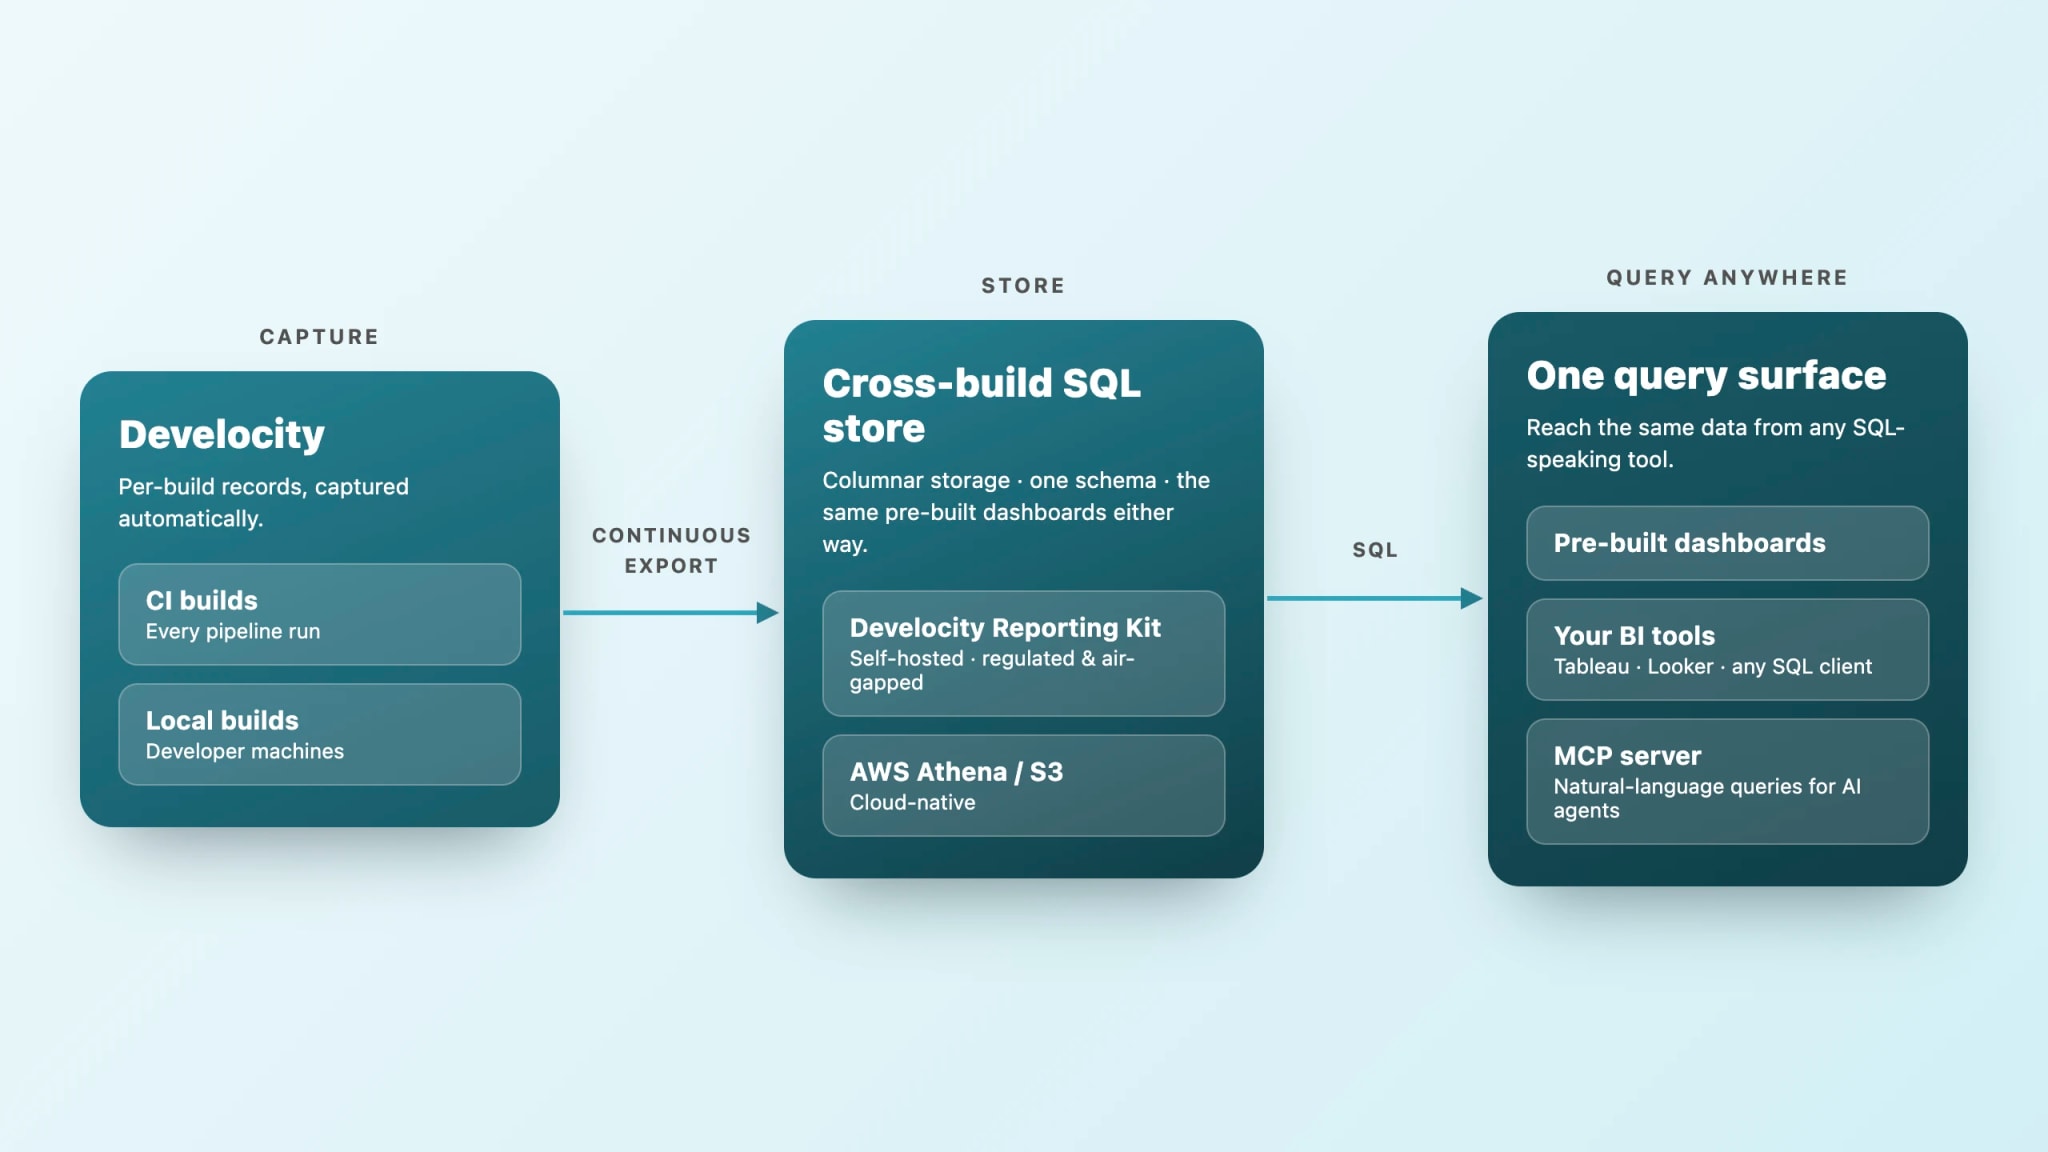
Develocity Analytics architecture — per-build records from CI and local builds export continuously into a cross-build SQL store (self-hosted Develocity Reporting Kit or cloud-native AWS Athena/S3), queried in SQL from pre-built dashboards, BI tools, and an MCP server for AI agents.

Find what per-build inspection cannot — cross-project concentration, gaps, and misconfiguration

  • Rank projects by build-time concentration, failure rate, or parallelization gap in a single query — at a large bank, 42 of 4,000 repos consumed 50% of all build time.
  • Catch cross-project misconfiguration — at a large enterprise, a query across 500,000+ builds in 77 projects found one project with zero Build Cache usage, invisible from any per-build view.
  • Quantify recoverable build time across teams — the Realized Test Acceleration Savings and Build Volume & Savings dashboards aggregate per-build outcomes into the totals that show where acceleration pays off.
  • Monitor JDK compliance, CI provider migration, plugin sprawl, test results, or dependency usage by build volume — filter any pre-built dashboard by project, team, build tag, or custom value.
Develocity Analytics Build Failures dashboard over a 90-day window — CI builds and CI build time split by failure type (all, failed, non-verification, verification), surfacing failure volume across the organization.
Agent Context

Query build data in plain language — the analytics model turns every question into valid SQL

  • With the Analytics MCP server enabled, AI agents can ask natural-language questions about build data — questions that resolve to the same SQL behind the pre-built dashboards.
  • Built-in tools let an agent explore and query the data unaided — query execution, column inspection, dashboard discovery, and validated patterns — with no prior schema knowledge.
  • The schema is based on Develocity's per-build capture, so agent answers come from the actual build records — not sampled or inferred data.
  • Tested queries include CI provider enumeration, JDK LTS detection, per-user failure rates, and dependency compliance — all reachable through MCP Servers in natural language.
Chat panel of an AI agent querying Develocity Analytics over MCP — a natural-language flaky-tests question, an execute_query tool call against the test_performance_summary table, and a ranked answer table of the three flakiest test tasks.
Observability

Build Scan captures one run; Analytics reveals the pattern across thousands

  • Turn per-build records into cross-build trends — Analytics lifts what Build Scan already captured into queryable SQL with no additional instrumentation required.
  • Watch current state live, or query the whole history — the Observability Data Platform is the real-time in-product view; Develocity Analytics is the SQL layer for historical and multi-year analysis.
  • Builds are kept continuously up to date — new builds become queryable within ~30 minutes, and existing ones are rechecked so updates and deletions stay in sync automatically.
  • Every custom value, CI tag, and build attribute Build Scan captures is queryable as SQL — no field is locked behind a fixed report or a manual data request.
Develocity Analytics trends over a 90-day window — projects, builds, and build time per build tool and per environment, as time-series line charts across the organization.
Governance

All four DORA metrics are SQL queries — no separate build-data pipeline required

  • All four draw on data Develocity already captures per build — deployment frequency, lead time, change failure rate, and time to restore.
  • Find every project using a vulnerable dependency in minutes — a single SQL query against the dependency tables answers the question without building a separate dependency inventory.
  • Track JDK migration compliance by build volume, not self-reported team status — the JVM Version Analysis dashboard shows vendor, version, and LTS/non-LTS distribution across every project.
  • Expose the gaps, then enforce compliance — Analytics identifies zero-cache projects and CI drift; Policy Scan applies the policy.
Develocity Analytics JVM Version Analysis dashboard over a 90-day window — projects per JDK version (all environments, CI, and local), showing the JDK version spread across the organization.

Resources

Monitoring Build Performance at Scale
Blog
Optimize your Gradle, Maven, sbt, and Bazel builds with resource usage data
Blog
Introducing Develocity 360: Toolchain Observability
Blog
Visualizing Develocity Data with Prometheus and Grafana
Blog

What's next

Get started today with a 30-day free trial of the entire Develocity product suite.

Start Free Trial

© 2026 Gradle, Inc. Gradle®, Develocity®, Build Scan®, and the Gradlephant logo are registered trademarks of Gradle, Inc.

Get an AI summary of Develocity: