Gradle Technologies is now Develocity — read the announcement

Repository Managers

Not every red build is your code. Unstable upstream repositories add latency and cause failures — as AI agents scale build volume, the cost compounds across every run.

The Develocity Analytics Repository Stability dashboard showing the number of distinct binary repositories with at least one failed download, total download failures, and serial time lost; below, failure category breakdowns across all builds, CI only, and local only.

Feature overview

Repository Managers

Upstream rate-limiting, connection timeouts, and missing artifacts slow builds and cause failures. Develocity captures the full resolution record of every build: HTTP timing, outcome, and origin per dependency. Develocity Analytics shows which repositories are degrading across the organization, categorized by failure type, so the pattern surfaces before isolated failures cascade. Develocity MCP Servers make it queryable in plain language. The same per-build record also surfaces whether any dependency resolved outside the configured repository manager; that provenance record is what Policy Scan and Dependency Compliance enforce against.

Pinpoint which repositories degrade your builds

  • Get the signal before individual repository failures cascade — the Develocity Analytics Repository Stability dashboard aggregates download failures across every build.
  • Distinguish transient from chronic upstream failures on CI — connection timeouts, rate-limiting, and server errors each trended over time.
  • Correlate dependency download failure spikes with build failure waves — query Develocity MCP Servers to separate an upstream repository incident from a code regression.
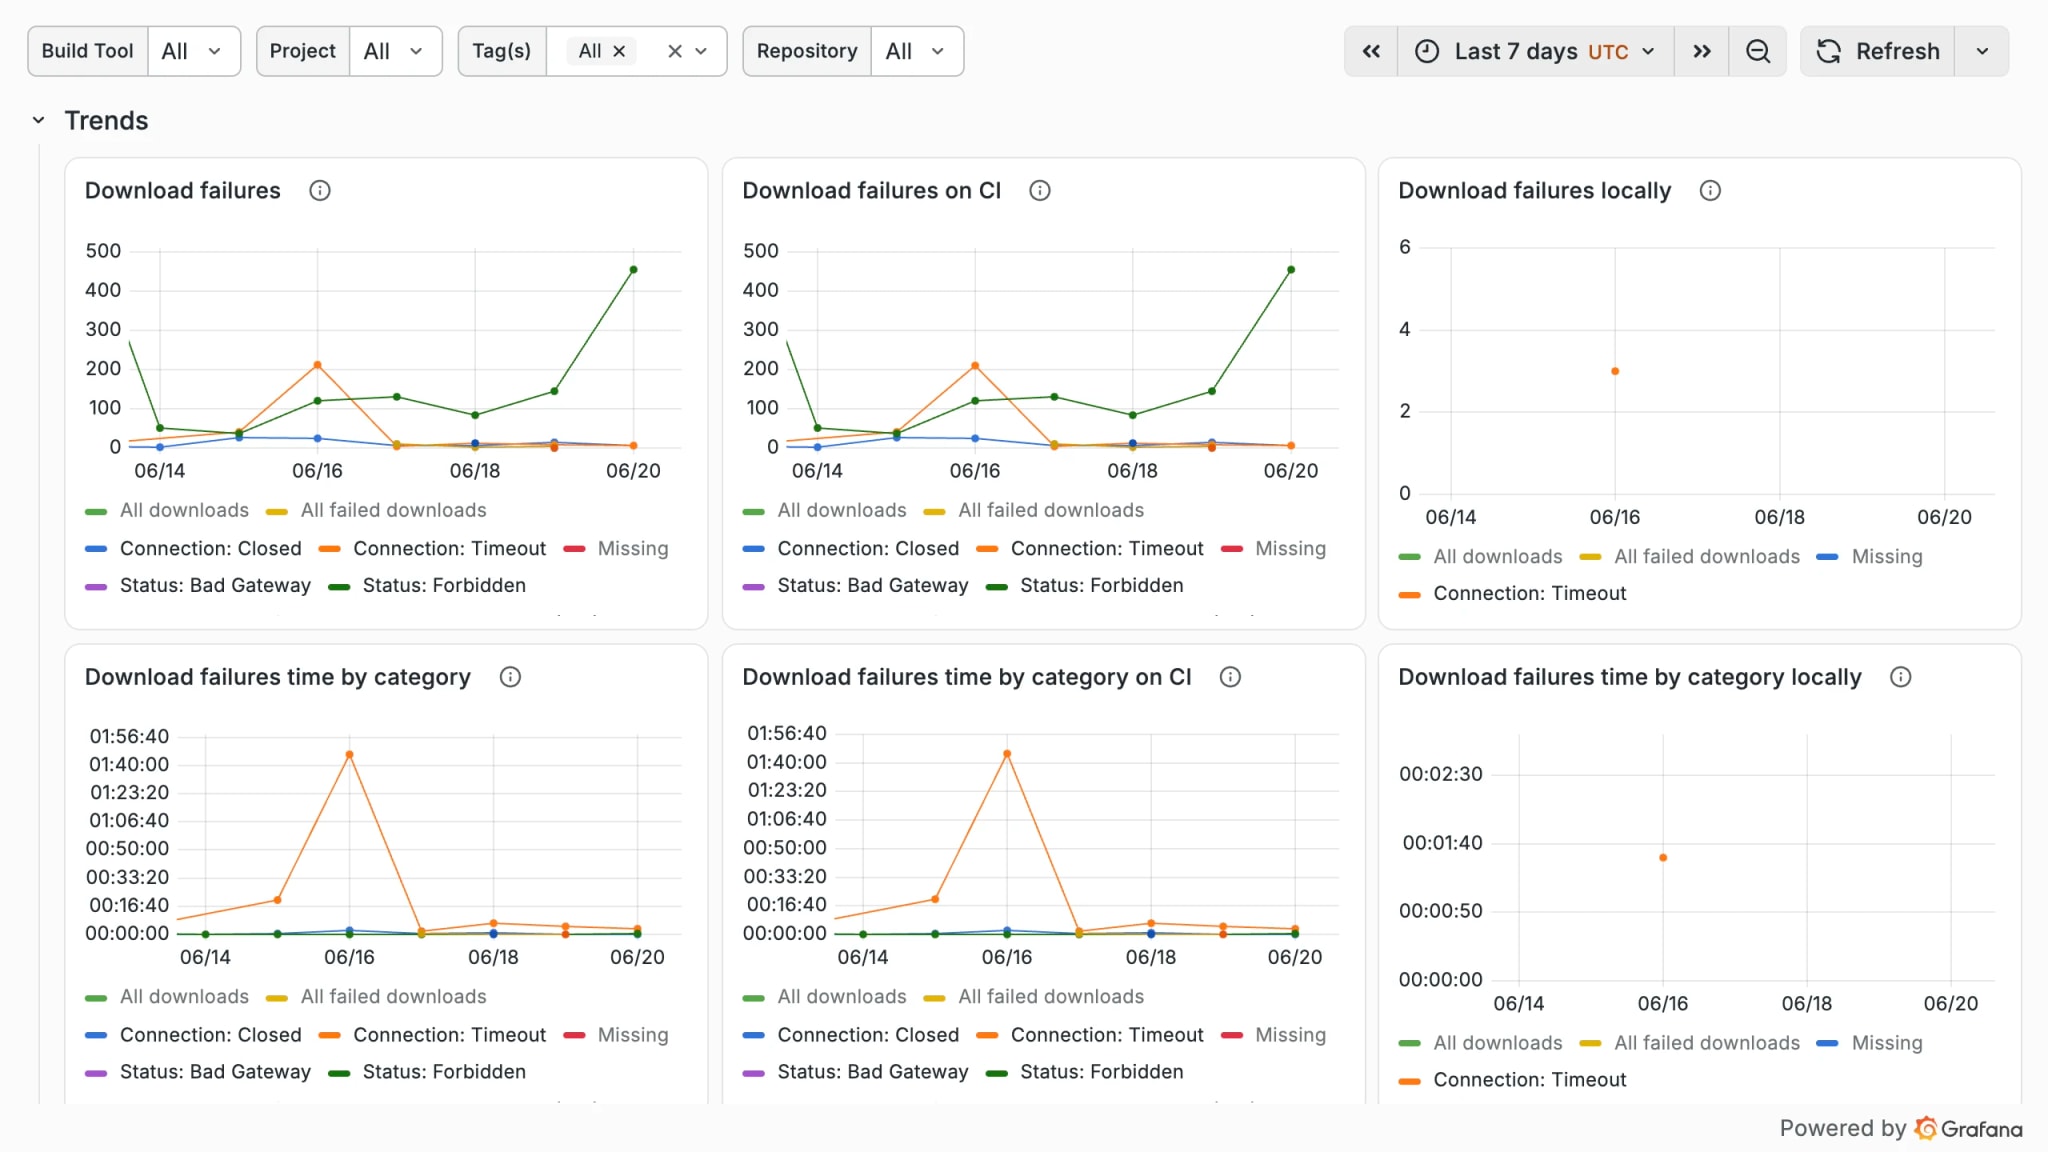
Repository Stability dashboard showing download failure trends by category — connection timeouts, rate-limiting, and server errors — across all builds, CI, and local, with pie charts showing failure category distribution.

Know the cost of slow upstream repositories

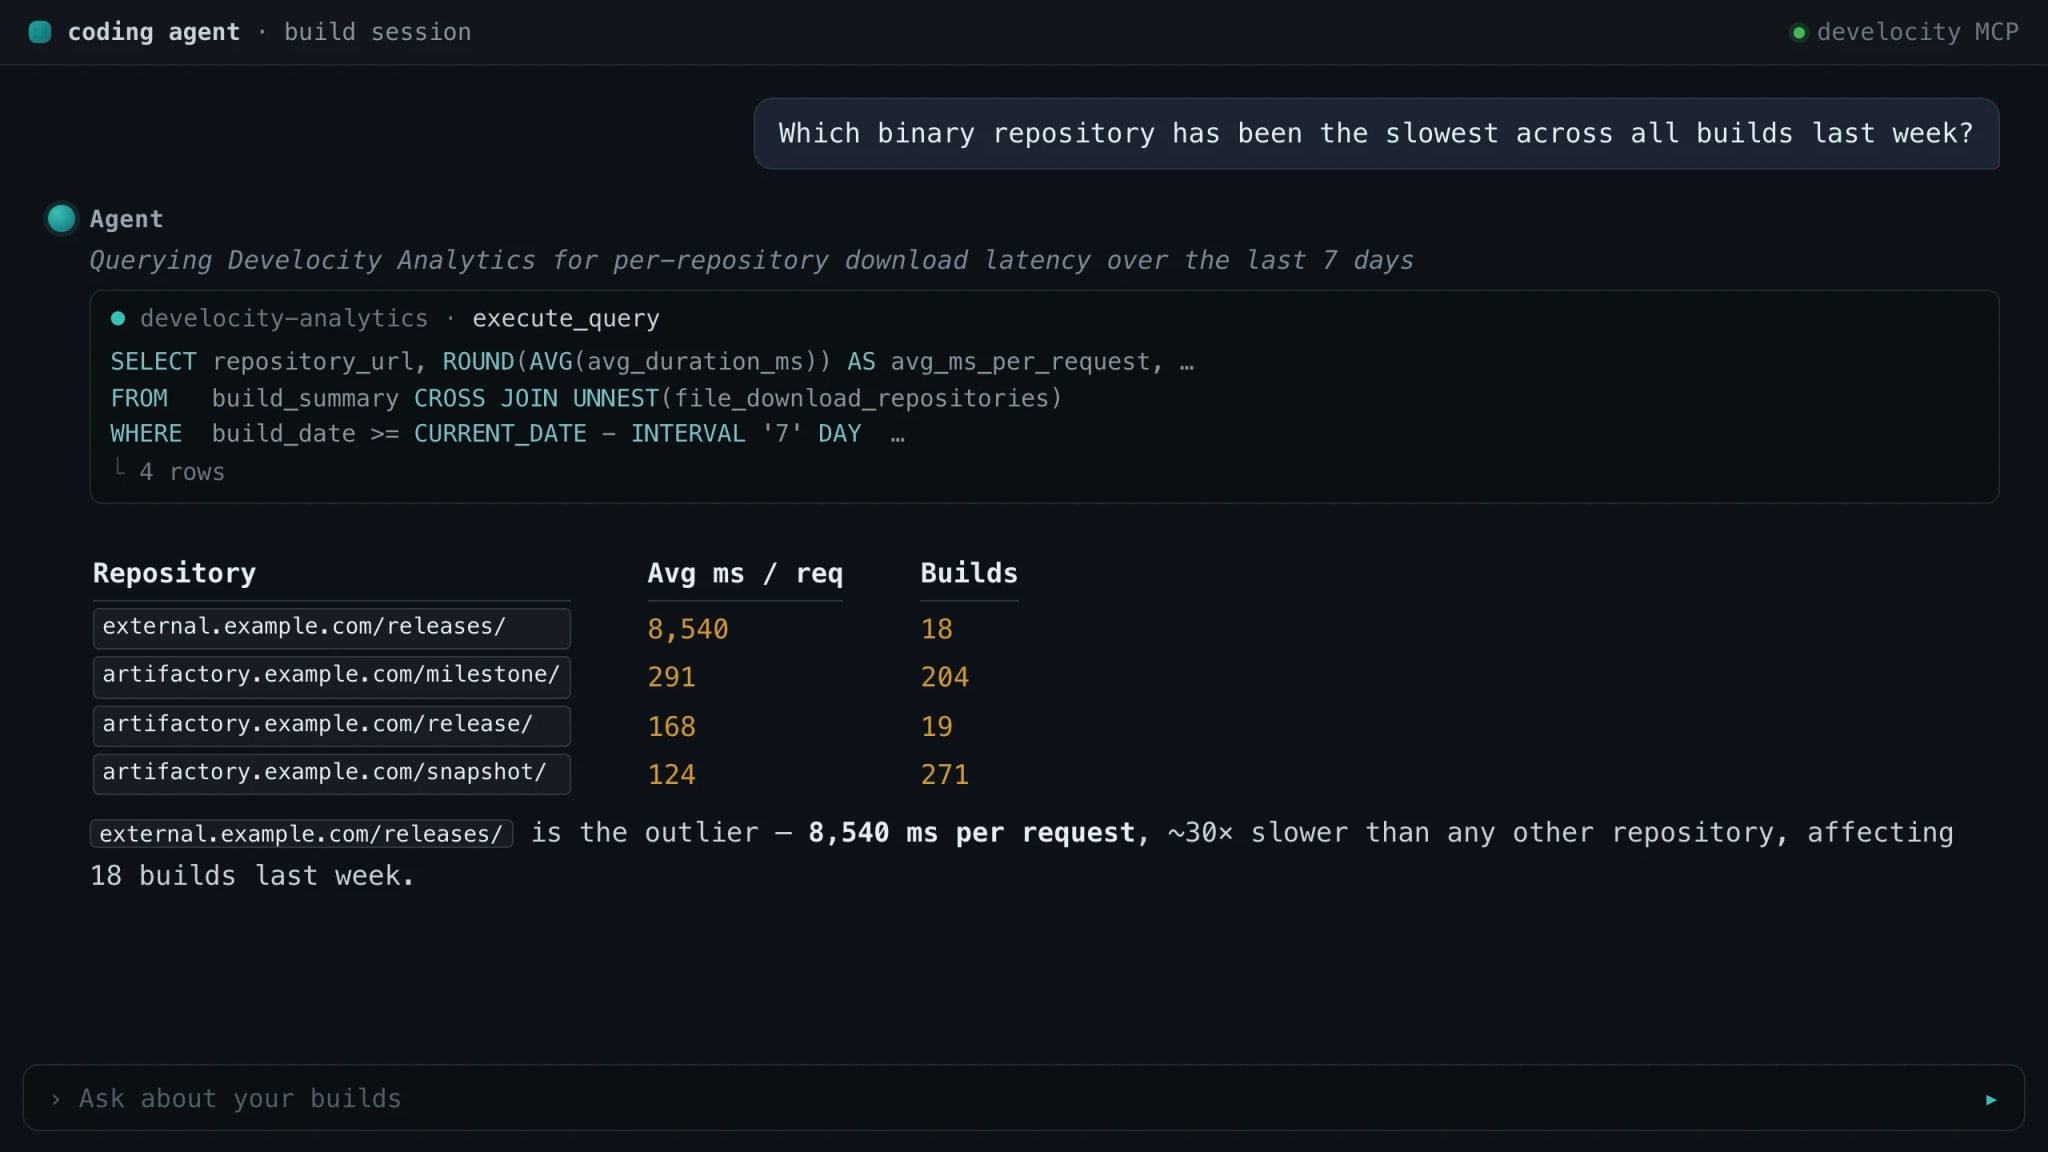
  • Identify the worst upstream offender — query Develocity MCP Servers in plain language: "Which repository was the slowest across all builds last week?"
  • Quantify the CI cost of slow dependency downloads — the Develocity Analytics Dependency Downloading dashboard shows how much time runners spend waiting per upstream source.
  • Measure the productivity cost of slow upstream repositories — wall-clock download time shows the build delay compounded across every run, local and CI.
AI agent identifying the slowest binary repository across all builds last week using Develocity Analytics via MCP.

Every network call on record

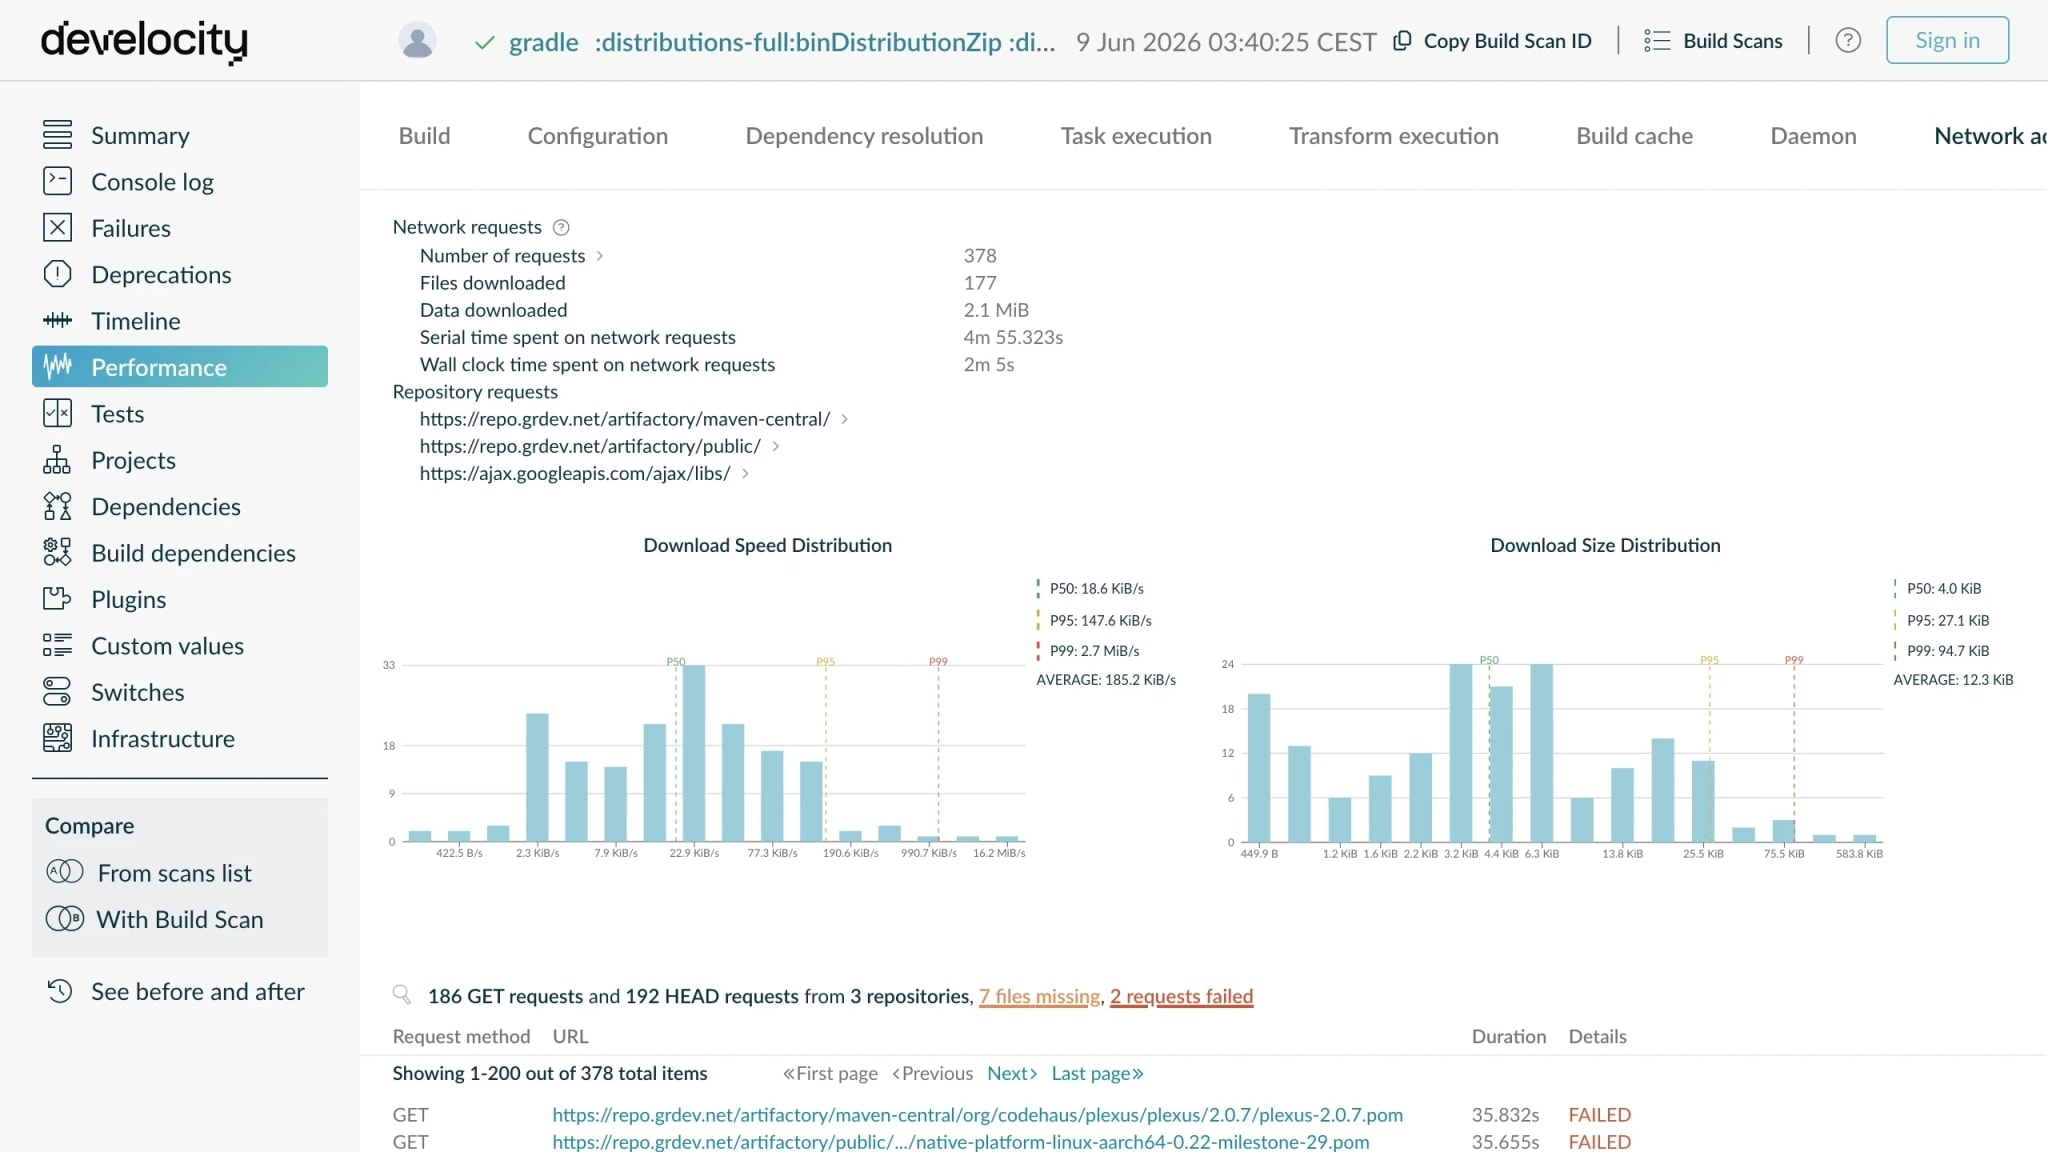
  • Inspect dependency resolution at request level — the Network Activity tab of any Build Scan records the URL, size, duration, and outcome for every download.
  • Drill into any slow build to identify the upstream repository that held up resolution — the slowest requests sort to the top, pointing directly to the bottleneck.
  • Spot download time regressions early — Performance Insights surfaces the spike, and Network Activity pinpoints which repository drove it.
Build Scan Network Activity tab showing individual HTTP calls during dependency resolution with URL, bytes, duration, and outcome per request.

Find the builds that bypassed your repository manager

  • Know where every dependency resolved from — Build Scan records the origin repository URL per artifact.
  • Compare dependency graphs across two Build Scan records to see when a new artifact source appeared — the evidence behind an unexpected resolution.
  • Isolate builds pulling directly from public registries — the Develocity Analytics Dependency Downloading dashboard breaks down downloads by origin.
  • Scope migrations, audit firewall changes, and verify mirror rollouts — the Develocity Analytics Dependencies dashboard shows which dependencies resolved from which source.
Build Scan Dependencies view with com.autonomousapps:antlr:4.13.2.0 selected, showing the dependency was downloaded directly from Maven Central instead of through the organization's Artifactory or Nexus proxy.
Analytics

Download volume, failure trends, and latency per upstream source

  • Size your binary-repository footprint before adding a mirror — Develocity Analytics surfaces total download volume per upstream source.
  • Trend download errors, latency, and volume — confirm whether a registry migration or repository-manager upgrade improved resolution or introduced new timeouts.
  • Justify CI infrastructure capacity decisions with data — if download time grows without a matching increase in build volume, the bottleneck is the upstream repository, not your runners.
Develocity Analytics Dependency Downloading dashboard showing total downloads, serial and wall-clock download time broken down by all builds, CI, and local.
Governance

Resolution provenance is the supply-chain record downstream gates need

  • Block builds that resolved outside your repository manager — Policy Scan enforces source-of-origin policy on what each build actually pulled.
  • Score the risk of every dependency a build downloaded — Dependency Compliance flags vulnerable or update-lagging versions.
  • Prove to any auditor exactly what each build resolved, per build and per dependency.
Policy Scan evaluation showing a FAILED Resolved Dependencies Repositories policy — the build resolved from Maven Central, the Gradle plugins portal, and an unauthorized repository, with remediation guidance to review policy configuration.

Resources

Measure, don’t guess: Making observability the key to performance tuning your software delivery
Blog
Supply Chain Observability with Develocity Provenance Governor
Blog
GenAI Won't Replace Your Continuous Delivery Pipeline—It Will Stress It
Whitepaper

What's next

Get started today with a 30-day free trial of the entire Develocity product suite.

Start Free Trial

© 2026 Gradle, Inc. Gradle®, Develocity®, Build Scan®, and the Gradlephant logo are registered trademarks of Gradle, Inc.

Get an AI summary of Develocity: