Gradle Technologies is now Develocity — read the announcement

Failure Analytics

Every build and test failure across your history, grouped by root cause and ranked by the engineering time it costs.

Failure Analytics Failures dashboard showing failure groups ranked by occurrence, with the top failure group accounting for ~49% of all failures over 28 days.

Feature overview

Failure Analytics

Every failure recorded in a Build Scan is encoded by a Develocity language model and grouped by root cause across the entire build history of a Develocity instance. The same infrastructure fault recurring across hundreds of runs collapses into a single failure group a platform team can triage, prioritize, and track over time. Build and test failures alike are classified as verification (compilation, test assertions) or non-verification (build config, infrastructure, environment), so the platform team's signal is separated from ordinary code quality work. Coverage follows the Build Scan envelope: local developer machines and CI alike.

See also

Works great with

Reduce hundreds of failures to a handful of root causes

  • Catch the same root cause when error text differs: exact-match signals handle the obvious cases first, then Develocity's own fine-tuned language model groups the rest by meaning.
  • Fix the root cause that halves the failure count: on one measured Develocity instance, 4,500 of 9,220 failures over 28 days collapsed to a single top failure group.
  • Track fix impact: failure groups have stable identities, so a group's daily frequency curve shows whether a shipped fix moved the number.
Failure Analytics five-stage pipeline from Build Scan ingestion through AI-powered analysis to failure group output.
Observability

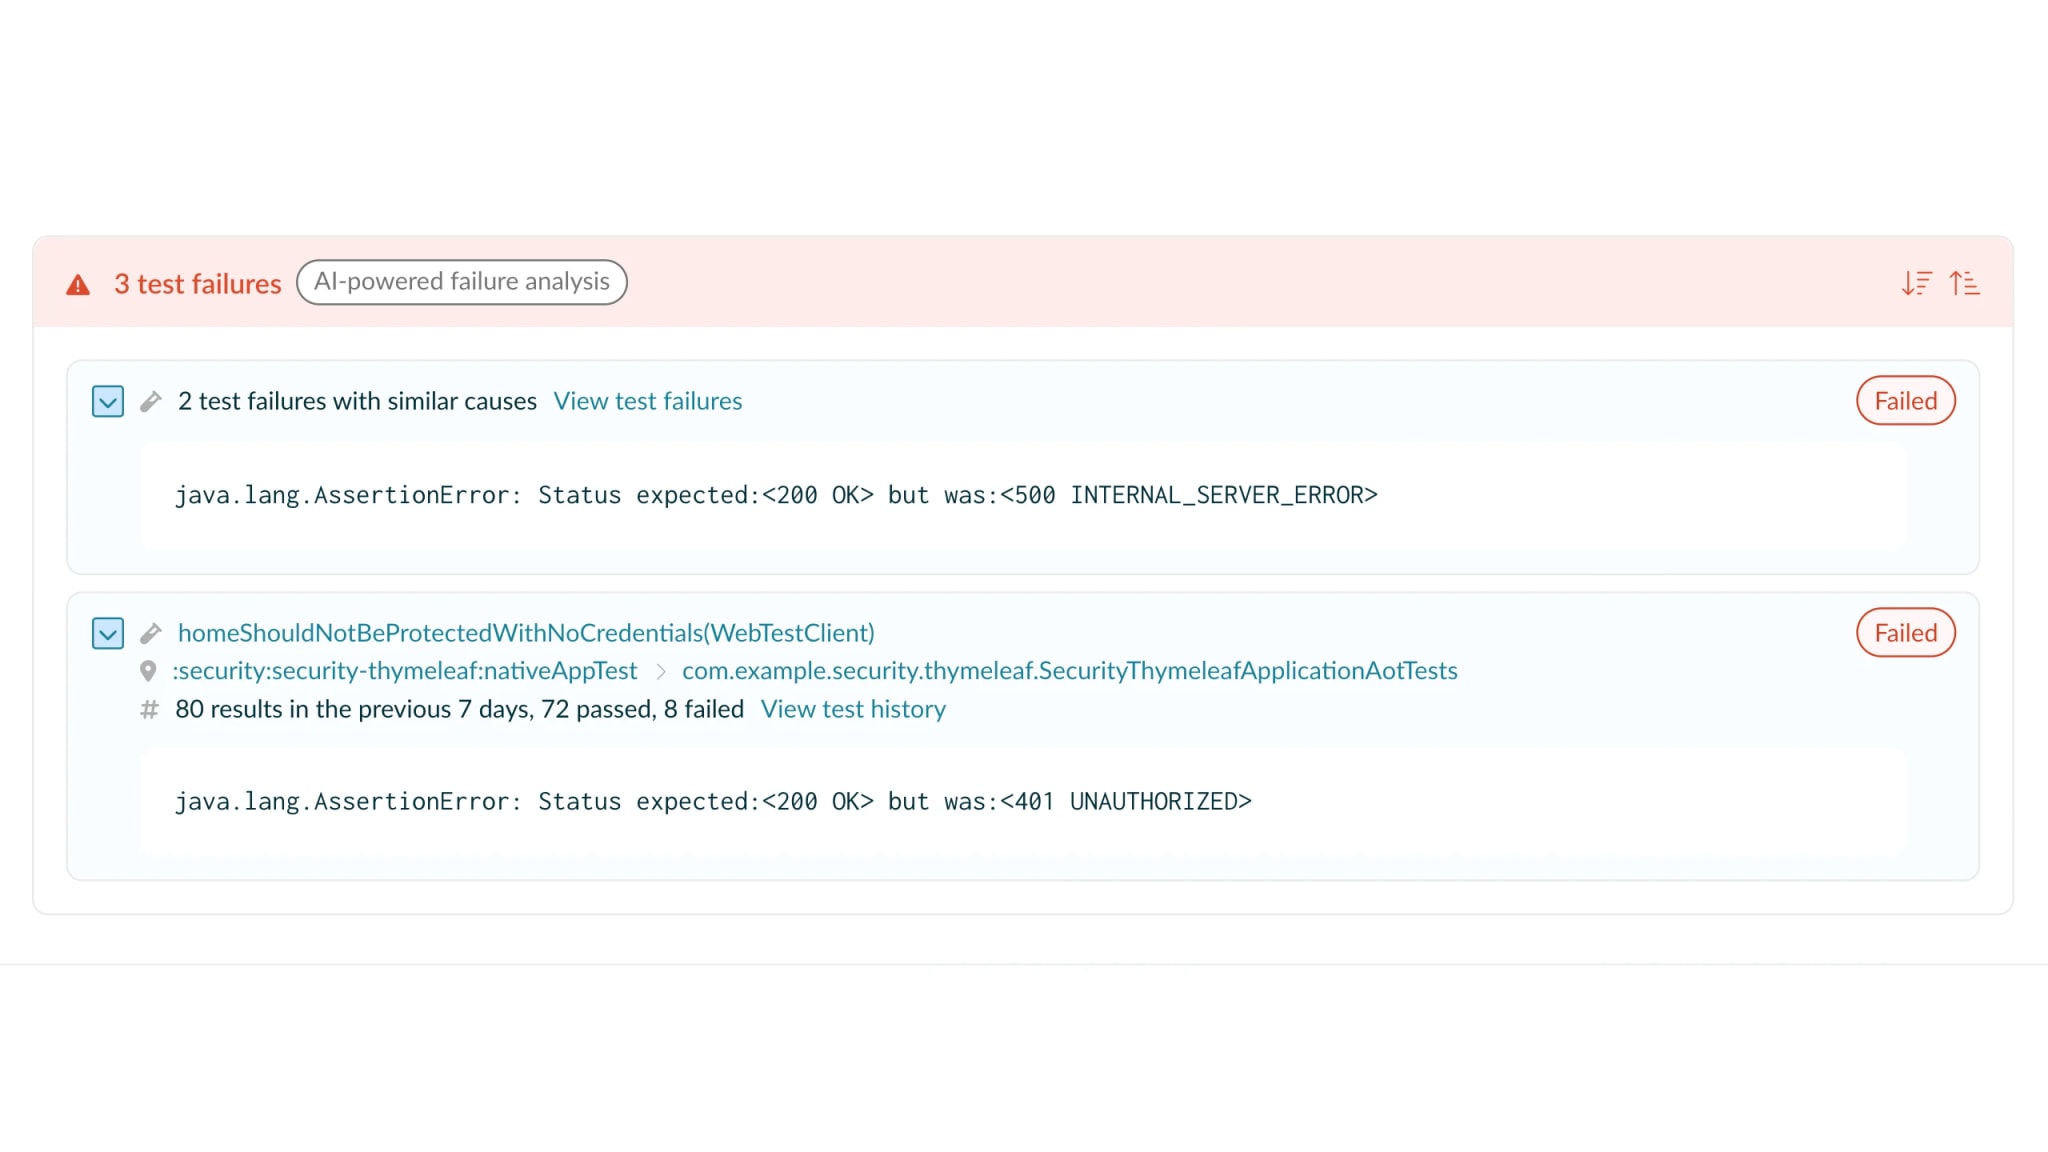
Know whether a failure is yours or org-wide — the cross-build failure group surfaces inline in every Build Scan

  • Scope a failure without switching tabs: frequency, affected users, and host breakdown are all in the per-build panel.
  • Move from pattern to cause without leaving Develocity: the cross-build pattern tells you what, the linked Build Scan tells you why.
  • Catch developer-machine failures alongside CI: every build that publishes a Build Scan is included in the analysis, wherever it runs.
Build Scan showing Failure Analytics grouped failure summary with failure group membership, cross-build frequency count, and affected users.
Analytics

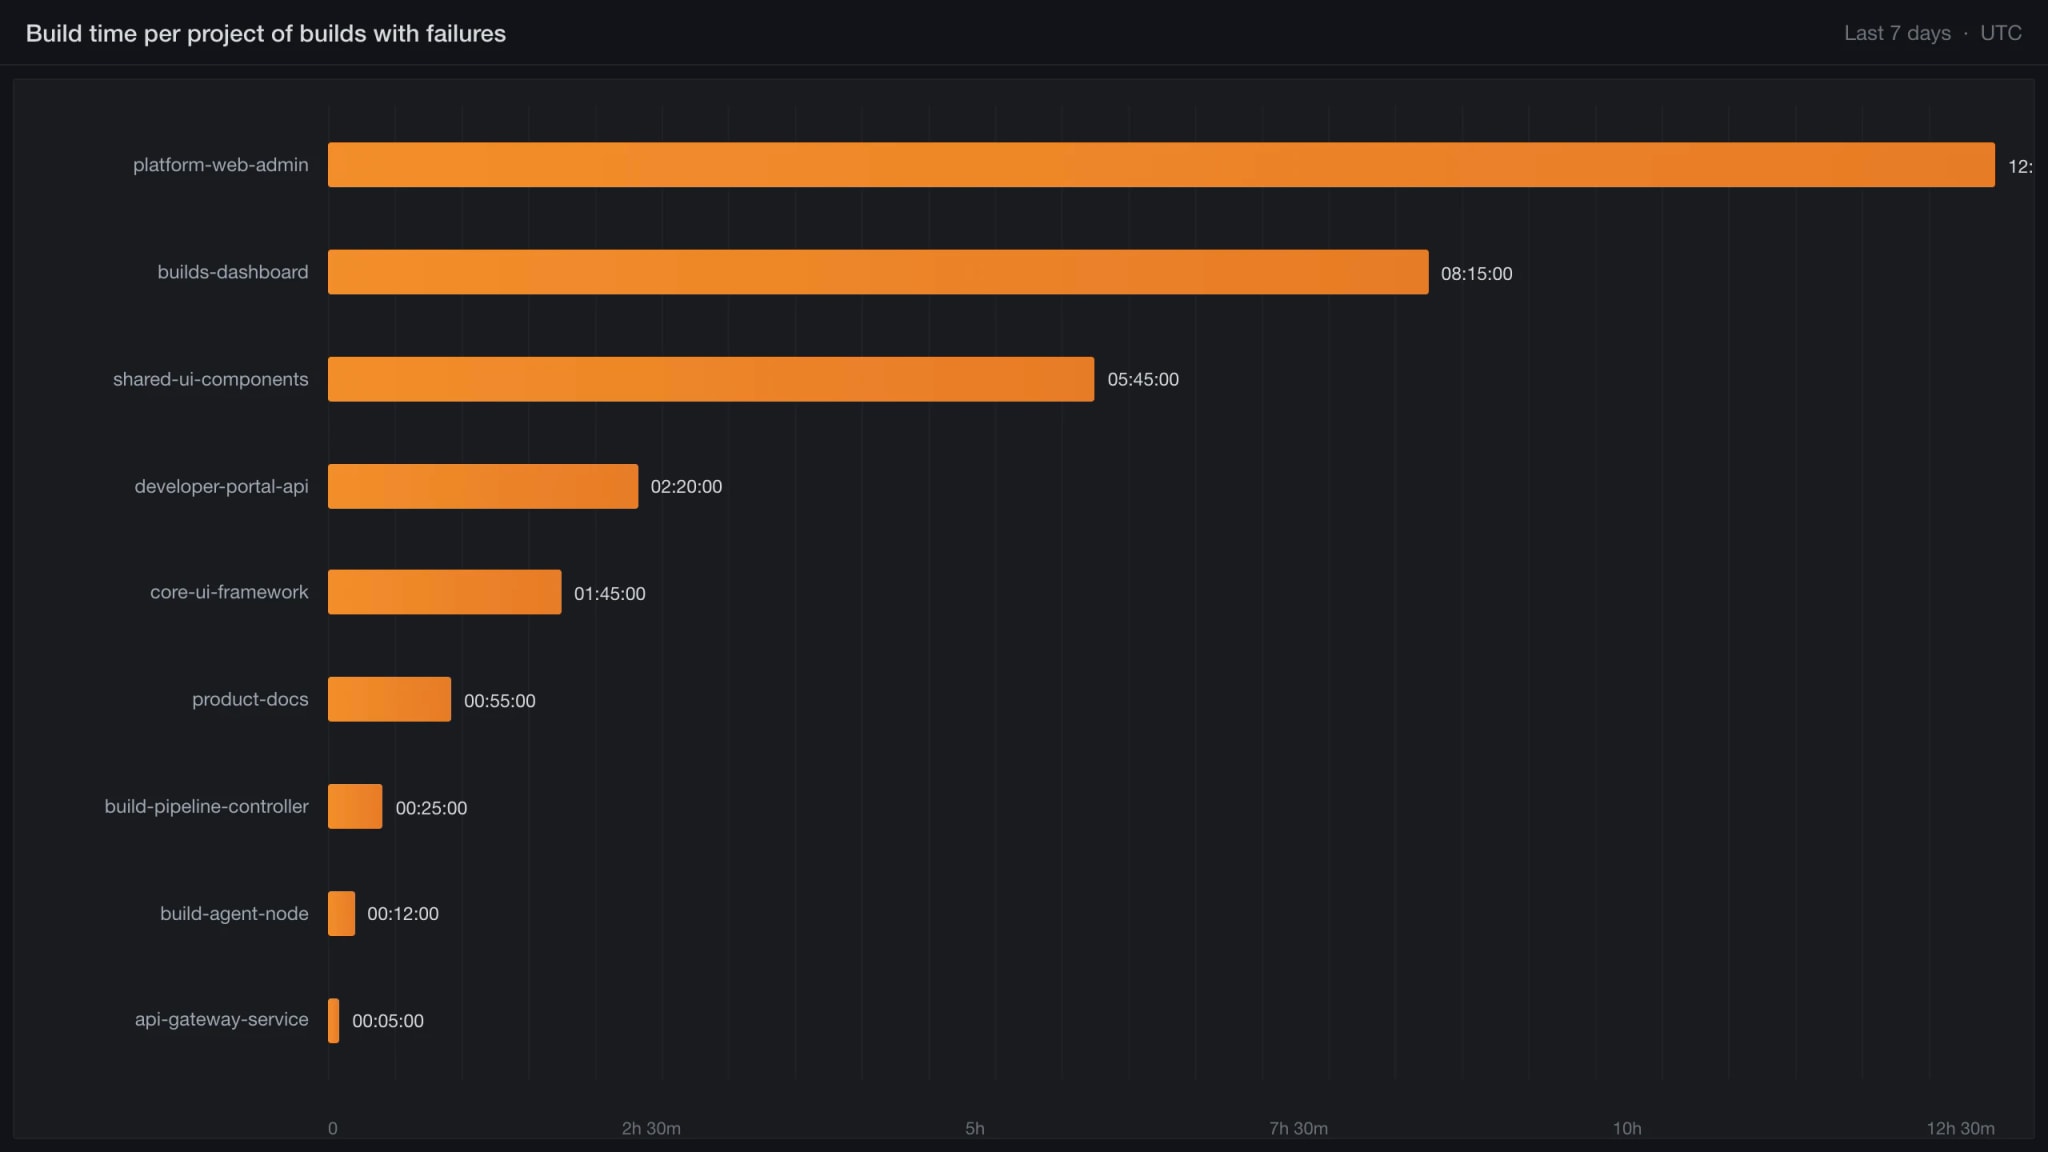
Your organization's CI failure cost, ranked by impact, not by timestamp

  • Rank projects by wasted CI build time, not failure count: Spring's CI showed the top 3 projects accounting for 91% of all failed build time.
  • Find always-failing CI configurations before they become background noise: 16 configurations across 7 Apache projects that never passed wasted more than 5 CI-days in a single 7-day window.
  • Track whether failure cost is rising week over week: Develocity Analytics trends failed build time by project, so a worsening pattern surfaces while it's still cheap to fix.
  • Start at org triage, end at root cause: Develocity Analytics ranks which project to address, Failure Analytics reveals which failure group explains it, Build Scan exposes why.
Develocity Analytics Build Failures view showing projects ranked by cumulative wasted CI build time with Pareto distribution visible.
Agent Context

Surface ranked failure groups in any AI agent, CI pipeline, or developer workflow

  • Query ranked failure groups from any AI agent: the failure groups tool in MCP Servers (Model Context Protocol) returns groups filterable by project, user, host, or date range.
  • Get answers without a dashboard: ask an AI agent 'What are the most common CI failures this week?' or 'Were there infrastructure issues in the last 30 minutes?'
  • Post 'this failure appeared 47 times this week across the org' inline in the pull request: a CI workflow calls the failures API before code review begins.
  • RoadmapNatural-language failure search: 'Am I the only one with this failure?' and 'When did this start?' answered from an IDE agent without leaving the editor.
AI agent interface showing a natural-language failure query answered by the Develocity MCP server with ranked failure group results.

Resources

Why did my build fail? Using AI to troubleshoot faster with failure summaries
Webinar
DPE 2024: Automating build failure analysis using semantic embeddings
Video
Determine the root cause of GitHub Actions failures faster
Blog
How AI-powered troubleshooting + the Develocity IntelliJ plugin helps fix problems faster
Blog

What's next

Get started today with a 30-day free trial of the entire Develocity product suite.

Start Free Trial

© 2026 Gradle, Inc. Gradle®, Develocity®, Build Scan®, and the Gradlephant logo are registered trademarks of Gradle, Inc.

Get an AI summary of Develocity: