Gradle Technologies is now Develocity — read the announcement

Performance Insights

See where build time and compute go, prove what each fix moved, and find the next bottleneck.

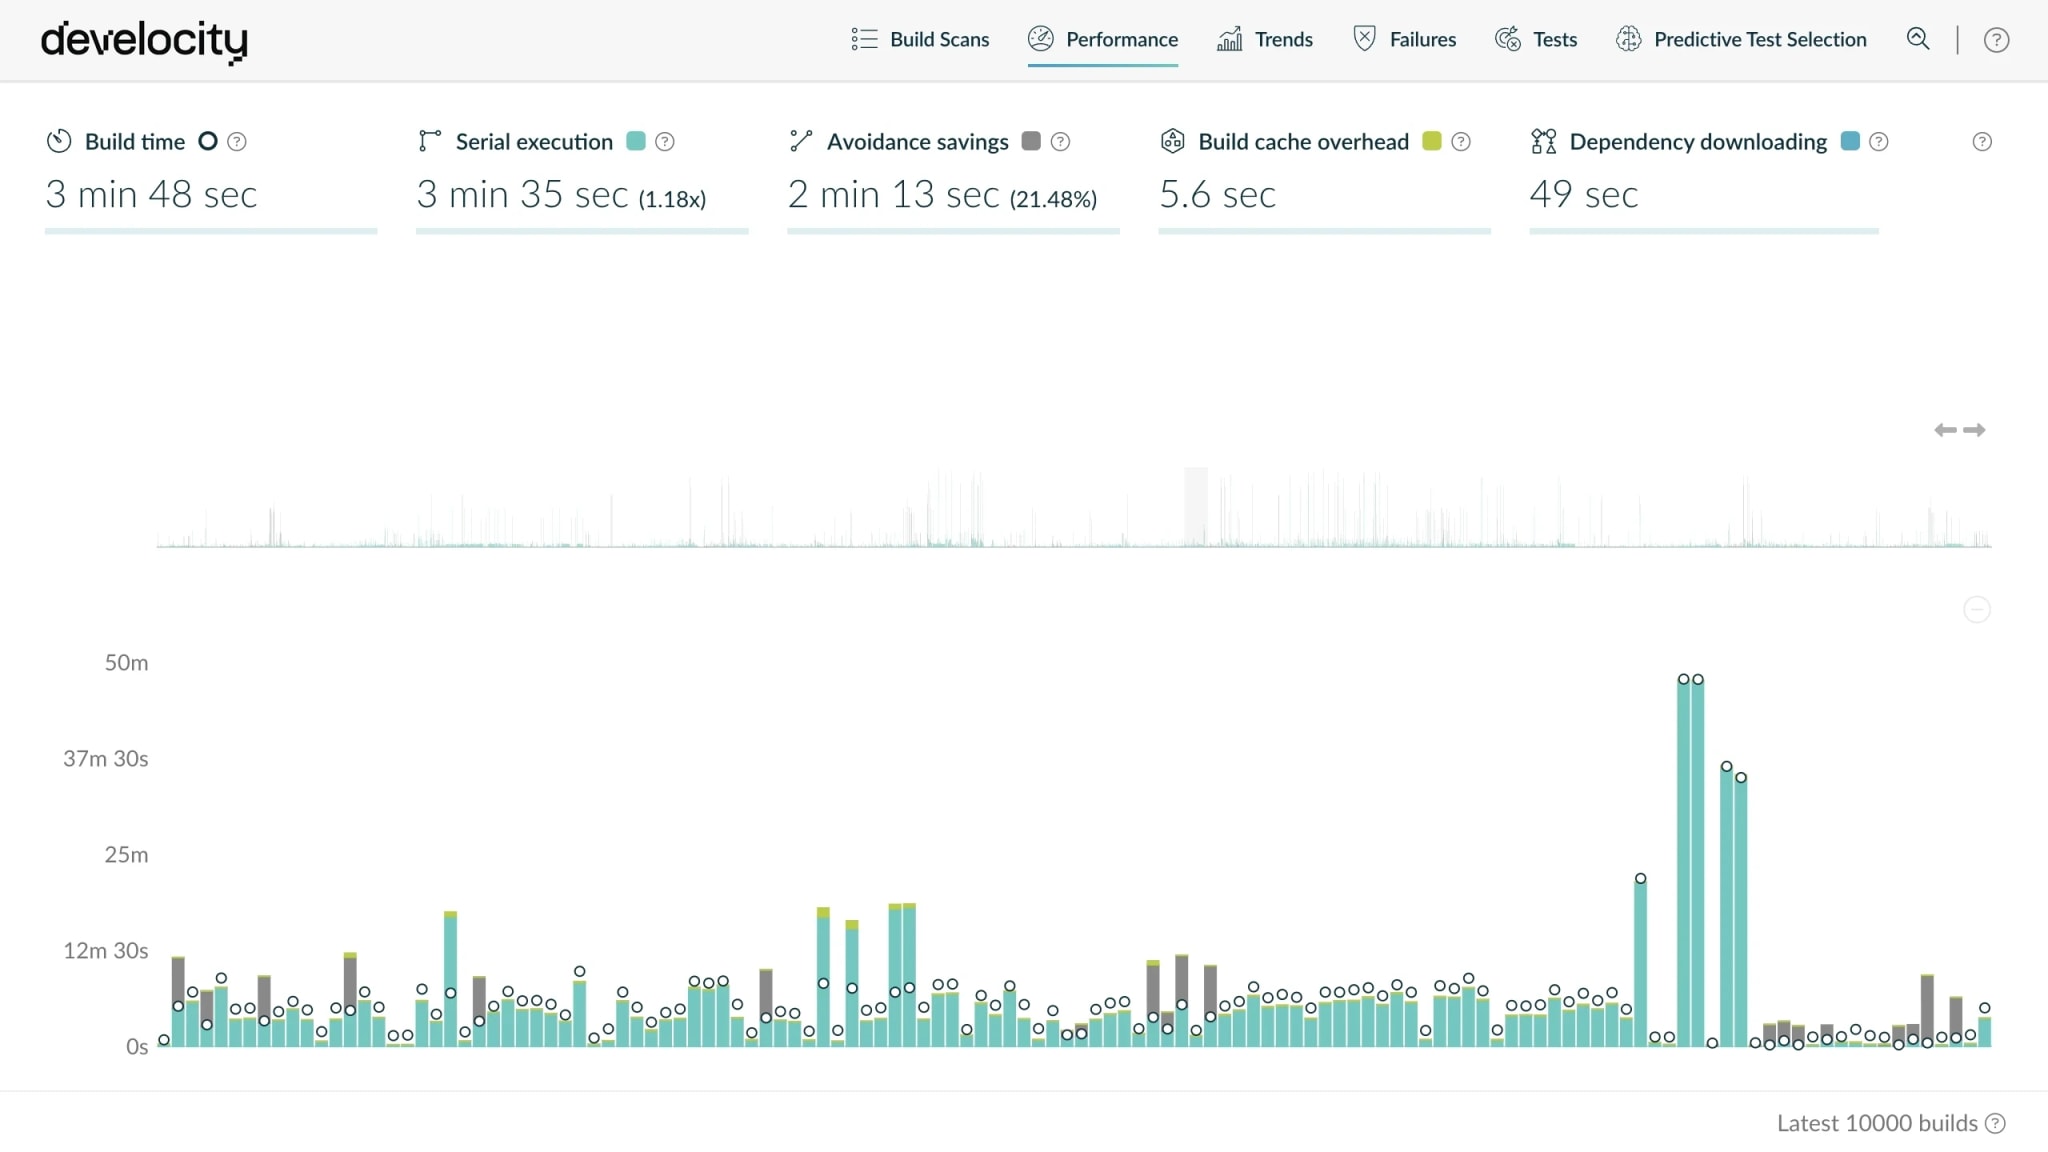
Develocity Performance dashboard showing build time, serial execution time, avoidance savings, Build Cache overhead, and dependency-download time across an organization's builds.

Feature overview

Performance Insights

Know where build time and compute go, prove every optimization landed, and catch regressions before they harden — Performance Insights reads the data Build Scan already captures on every build, local and in CI. The improvements it surfaces are independent of acceleration technologies such as Universal Cache, Test Distribution, and Predictive Test Selection. A Build Scan's Performance page breaks one slow build down to the task, dependency, or daemon behind it. The in-app Performance and Trends dashboards aggregate that data across the organization, filterable by build location and hardware configuration. Develocity Analytics exposes the same build data for custom queries and organization-wide trends. The same data reaches any AI agent through the Develocity MCP Servers.

Trace any slow build to its root cause

  • Isolate the task, plugin, dependency, or daemon causing a slow build using the Build Scan Performance page.
  • Identify inefficient build phases — such as configuration or dependency resolution — by measuring discrete build phase durations instead of relying on opaque CI step totals.
  • Compare a slow build against a fast one to see exactly what changed — the inputs, dependencies, or environment behind a performance regression.
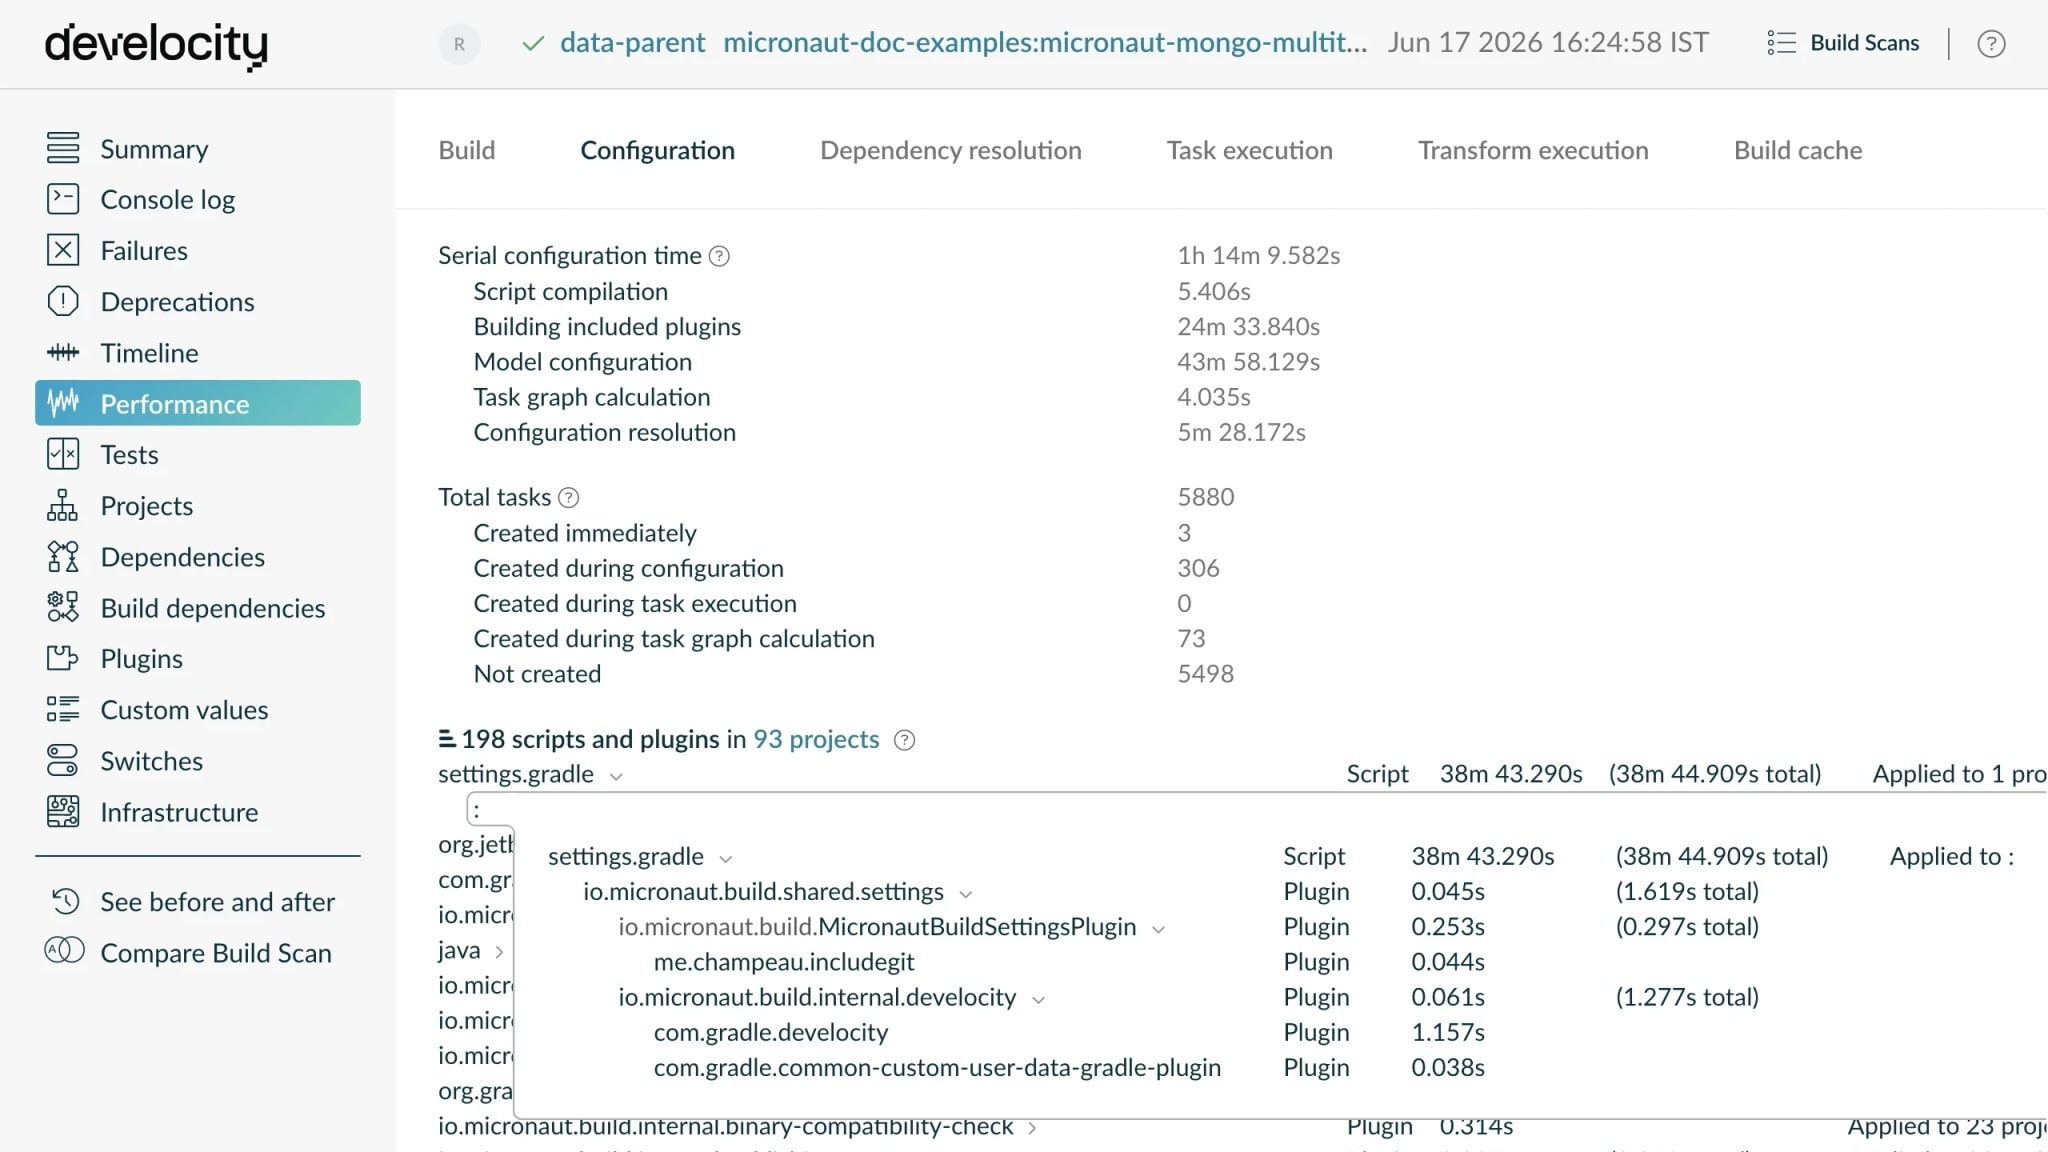
Build Scan Performance Configuration tab showing over an hour of serial configuration time split into script compilation, included plugins, model configuration, and configuration resolution, above a table of the scripts and plugins that took the most time.

Right-size build infrastructure based on real usage data

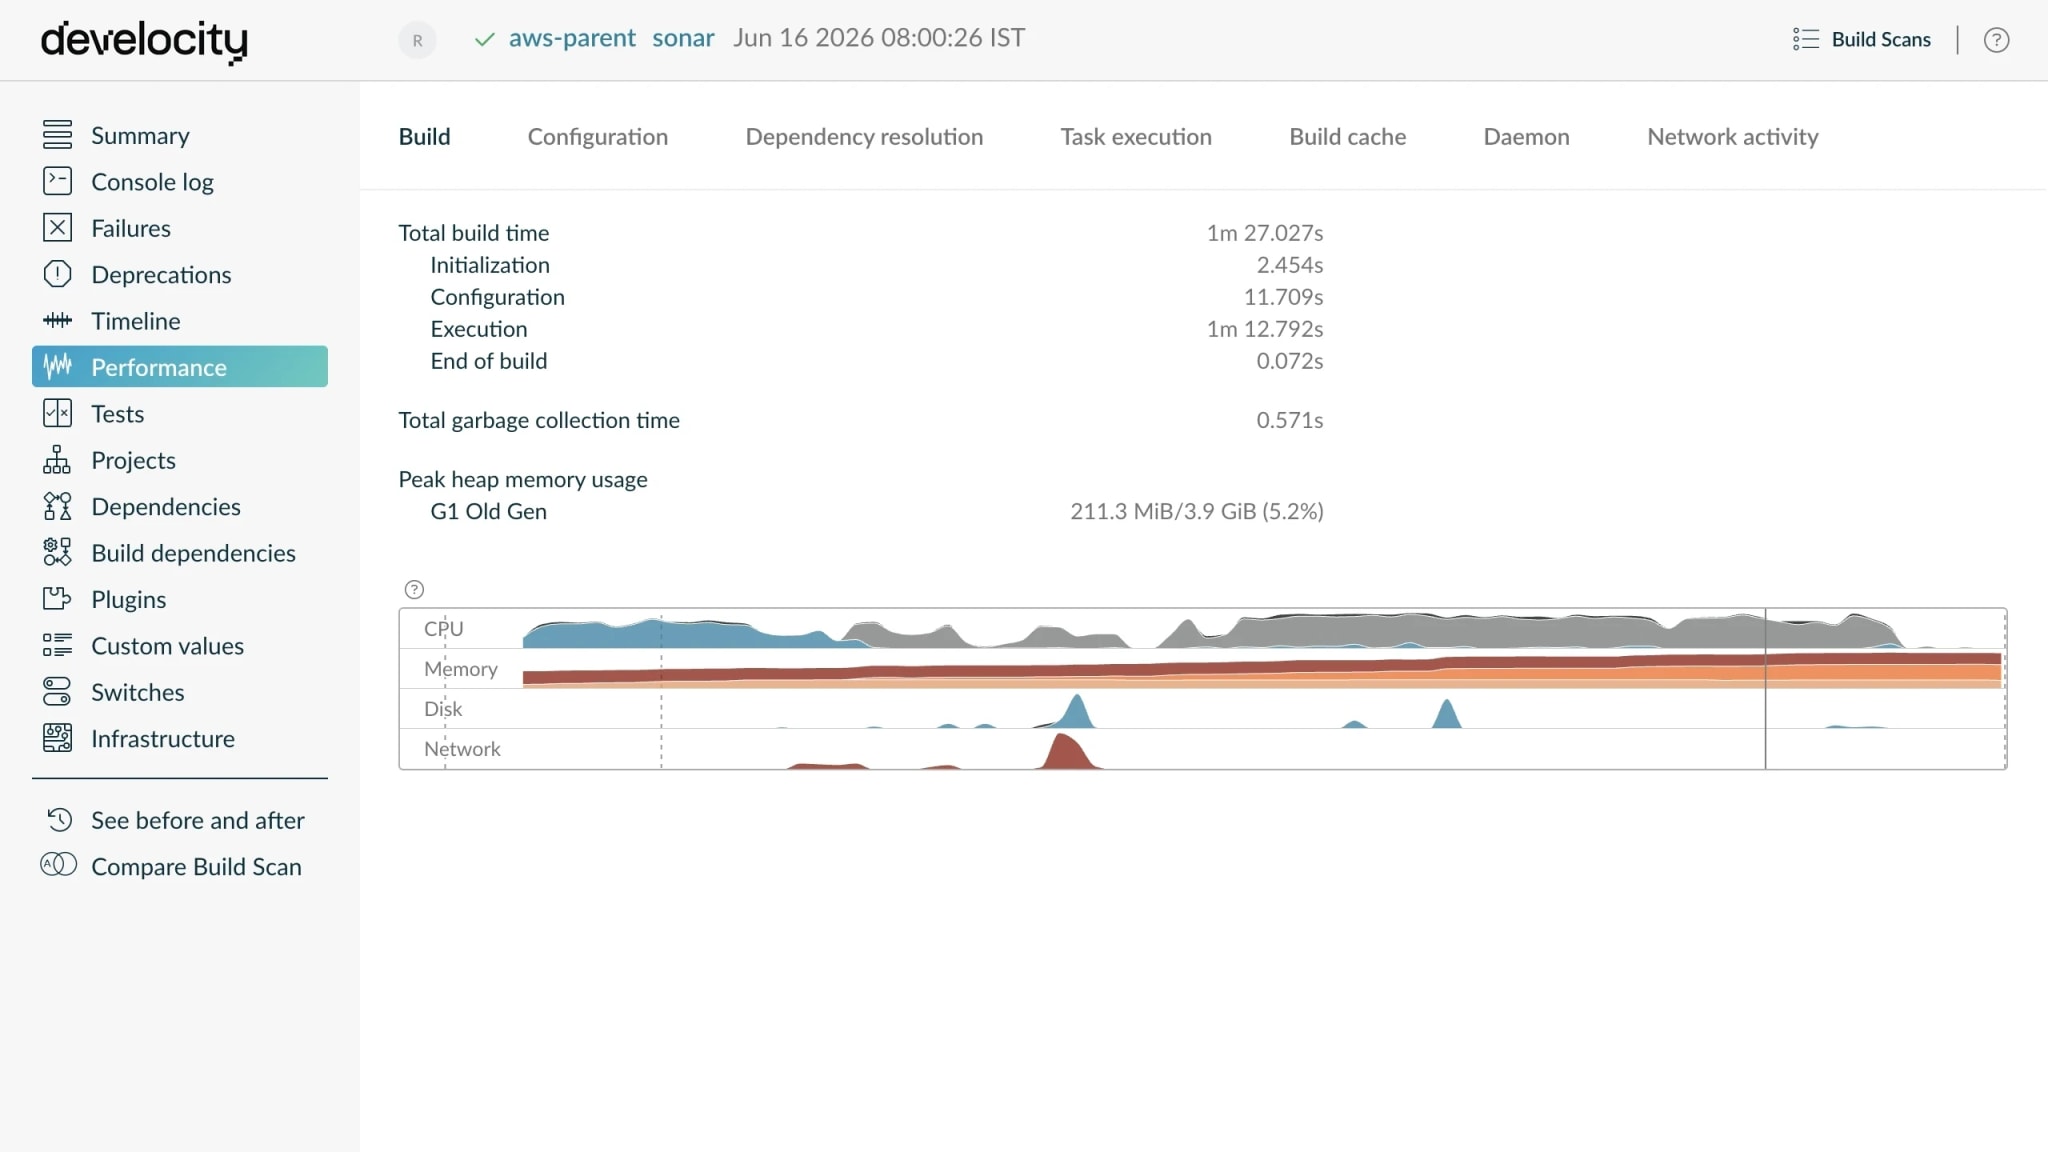
  • See how much CPU and memory builds actually use by reviewing the resource usage captured in Build Scan and Develocity Analytics.
  • Inform build infrastructure capacity planning for CI runners and developer workstations by spotting consistent over- or under-provisioning across builds.
  • Spot the tasks spending compute on work that could be reused — avoidance-savings metrics show what's recomputed instead of restored from cache.
Build Scan Performance page Build tab showing the build-time breakdown and CPU, memory, disk, and network resource graphs — the per-build usage behind right-sizing.

Catch performance regressions before they become the new baseline

  • Track build time, serial execution time, avoidance savings, and dependency-download time across all your builds using the Trends and Performance dashboards.
  • Catch systemic slowdowns — a dependency bump, a plugin upgrade, a slower CI runner — on the Trends dashboard, before a step-change becomes the baseline.
  • Every point on the Performance dashboard links to the individual builds behind it.
Develocity Trends dashboard showing build count and cumulative build time over a date range, with a build-time distribution and a non-execution versus execution split.
Agent Context

Give your AI agent the build data engineers read — and let it fix what's slow

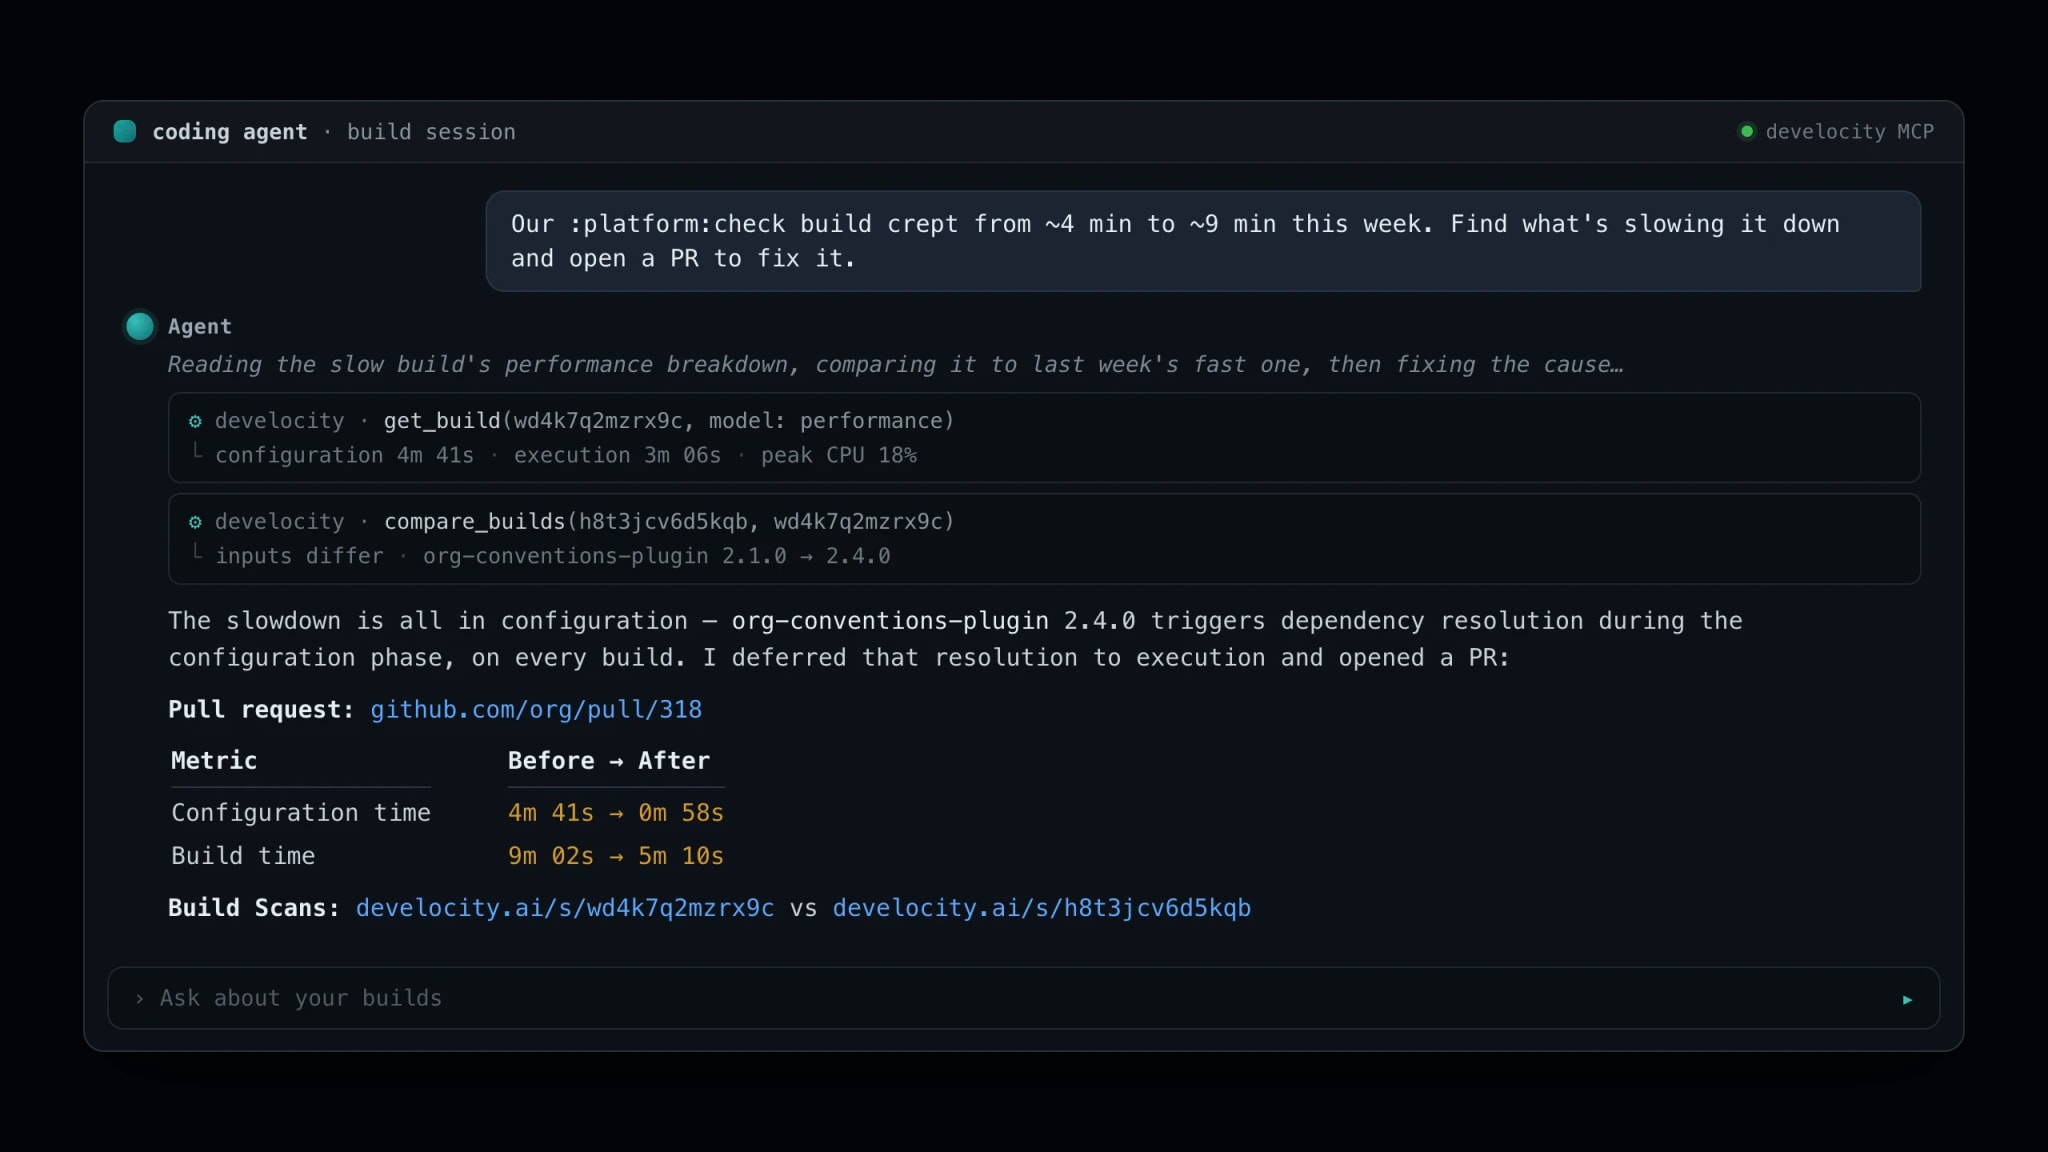
  • The same build performance breakdown an engineer reads — build-time phases, CPU and memory, network activity — is available to any AI agent through the Develocity MCP Servers.
  • The agent compares that build against a faster one to find exactly the input that changed — the cache miss or re-run behind the slowdown, not just the symptom.
  • With the cause identified, the AI agent applies the fix and opens a pull request.
  • Or hand the same data to a purpose-built agent — Develocity Agents act on these signals directly, identifying and fixing what slows builds across every project.
An AI agent session over the Develocity MCP Server — get_build performance and compare_builds diagnose a slow build's configuration-time dependency resolution, and the agent opens a pull request to fix it.
Analytics

Every under-used core is a build you can speed up or a resource you can save

  • Develocity Analytics dashboards surface the Gradle and Maven projects whose builds under-use CPU, run fewer workers than cores, or leave parallel execution switched off.
  • Each is a lever in two directions — add parallelism to cut build time, or provision fewer cores to cut the bill.
  • The biggest opportunities surface first — the projects still building serially and the runners provisioned well past the capacity they actually use.
Develocity Analytics CPU Usage dashboard showing full-versus-unused CPU across builds and the extra execution time per project from builds that don't use all available CPU.

Resources

Optimize your Gradle, Maven, sbt, and Bazel builds with resource usage data
Blog
Monitoring Build Performance at Scale
Blog
How AI-powered troubleshooting + the Develocity IntelliJ plugin helps fix problems faster
Blog
Observing build and CI productivity in your favorite OSS projects
Webinar

What's next

Get started today with a 30-day free trial of the entire Develocity product suite.

Start Free Trial

© 2026 Gradle, Inc. Gradle®, Develocity®, Build Scan®, and the Gradlephant logo are registered trademarks of Gradle, Inc.

Get an AI summary of Develocity: