Gradle Technologies is now Develocity — read the announcement

Test Distribution

Run a build's whole test suite across a shared pool of remote agents — locally and in CI, as one build.

Build Scan timeline showing a test task distributed across eight remote executors running in parallel.

Feature overview

Test Distribution

Test Distribution runs the tests of a single Gradle or Maven build across a shared pool of remote agents — replacing the standard Gradle Test task and Maven Surefire — and partitioning the suite by each test's historical execution time. No tests are rewritten and nothing is partitioned by hand: the build returns one log, one coverage report and one Build Scan, as if every test had run on the same machine. The same configuration drives a developer's laptop and the CI pipeline, so test wall-clock time tracks the size of the remote agent pool, not the size of the test suite — even as AI drives test counts up.

Overcome the single-machine bottleneck with test distribution

  • Test Distribution spreads a build's test classes across a remote agent pool, lifting CPU and memory constraints that cap fork-based parallelism on any single machine.
  • Build wall-clock roughly halves each time you double the number of remote agents, so it tracks the pool size, not the test count.
  • Once distribution eliminates test execution queue delays, the build's critical path becomes the slowest individual test class.
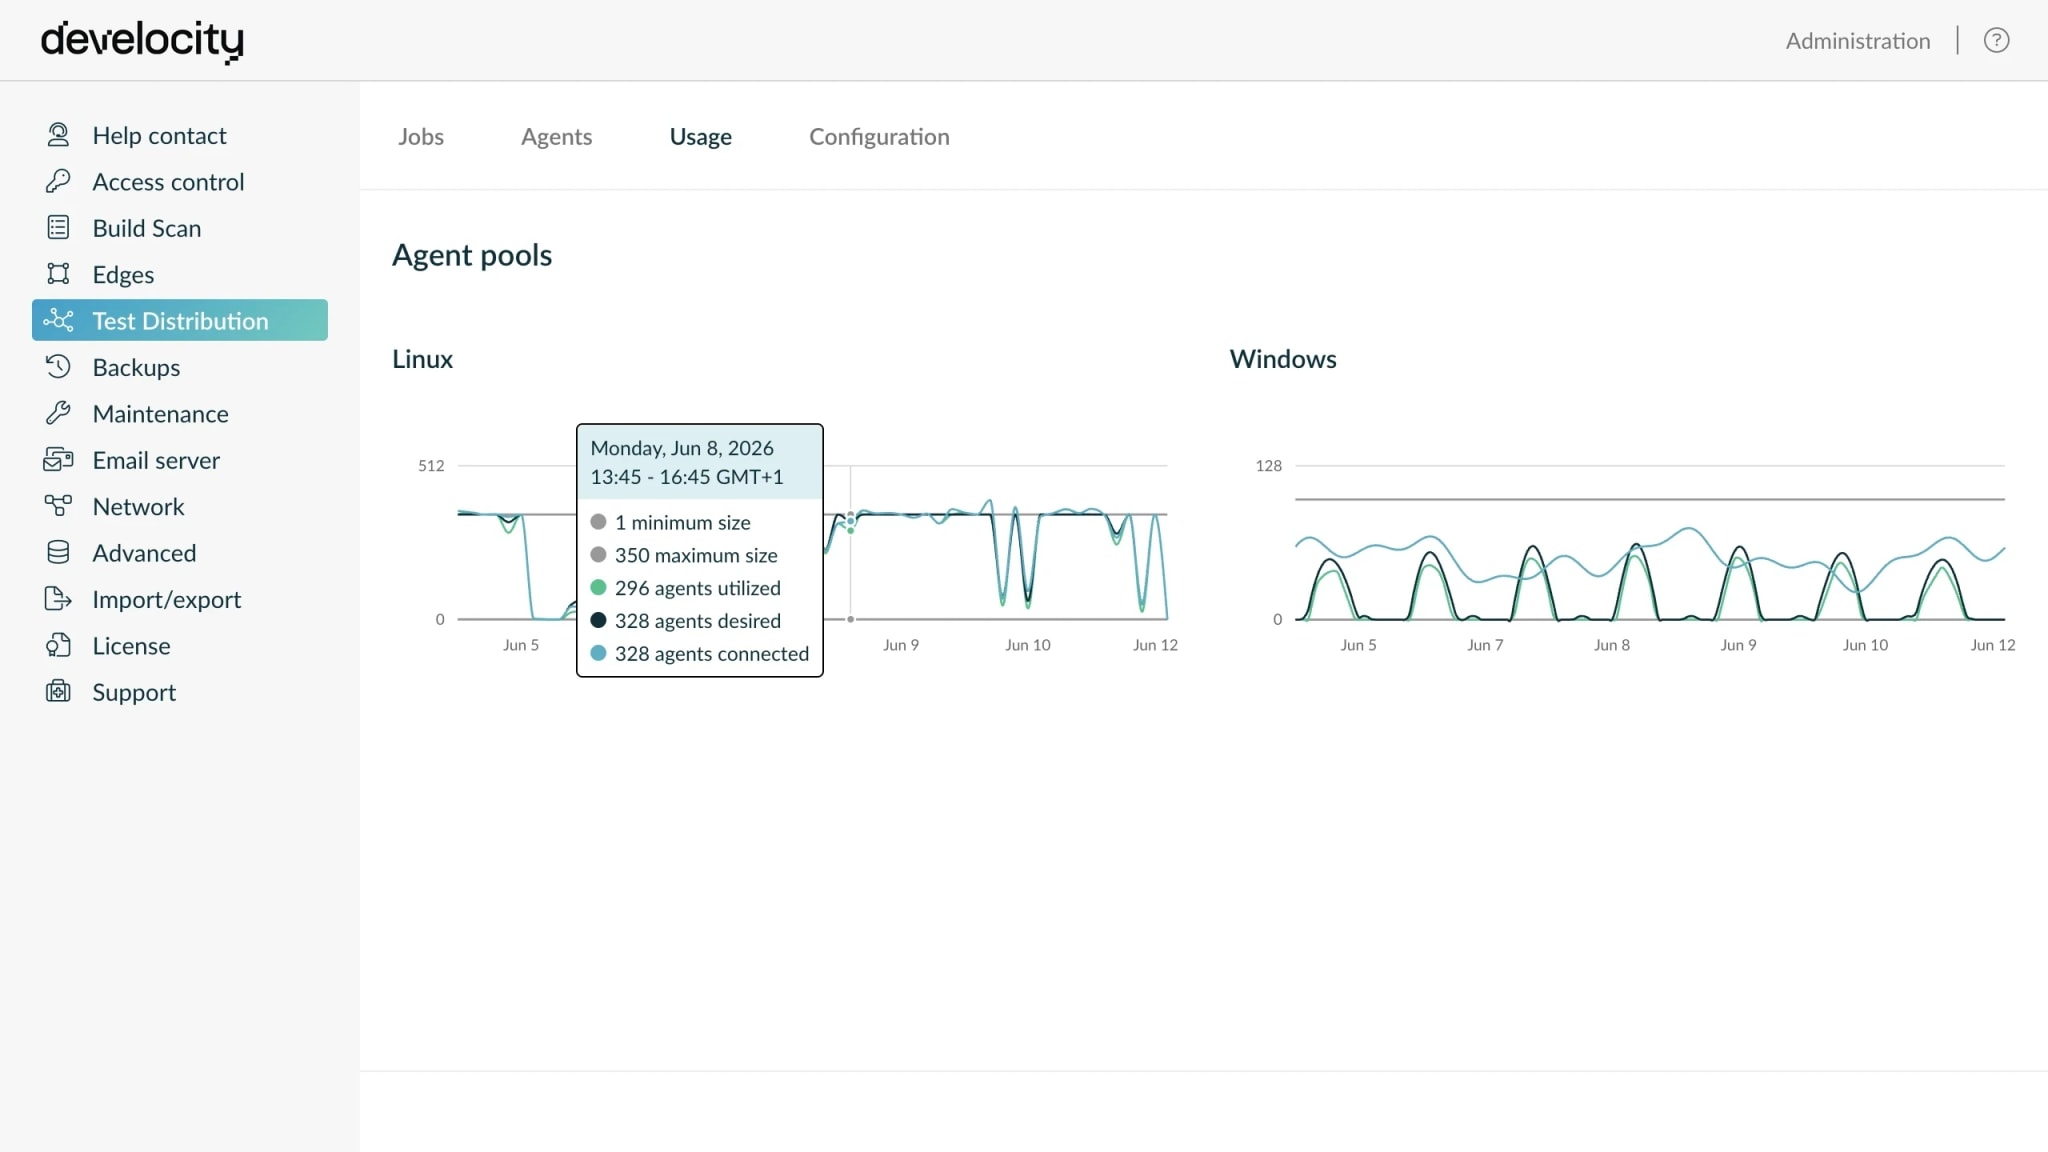
Test Distribution usage charts showing active jobs and agent utilization across a shared pool over a week.

Keep every agent working to the last test

  • The broker partitions work by each test's historical execution time, recorded in Build Scan, so the longest tests start first and all agents finish together.
  • When agents join or drop mid-build, the broker reschedules queued tests automatically — late-arriving agents speed up builds instead of sitting idle.
  • A flaky test's retry runs on the next free agent rather than waiting until the end of the build.
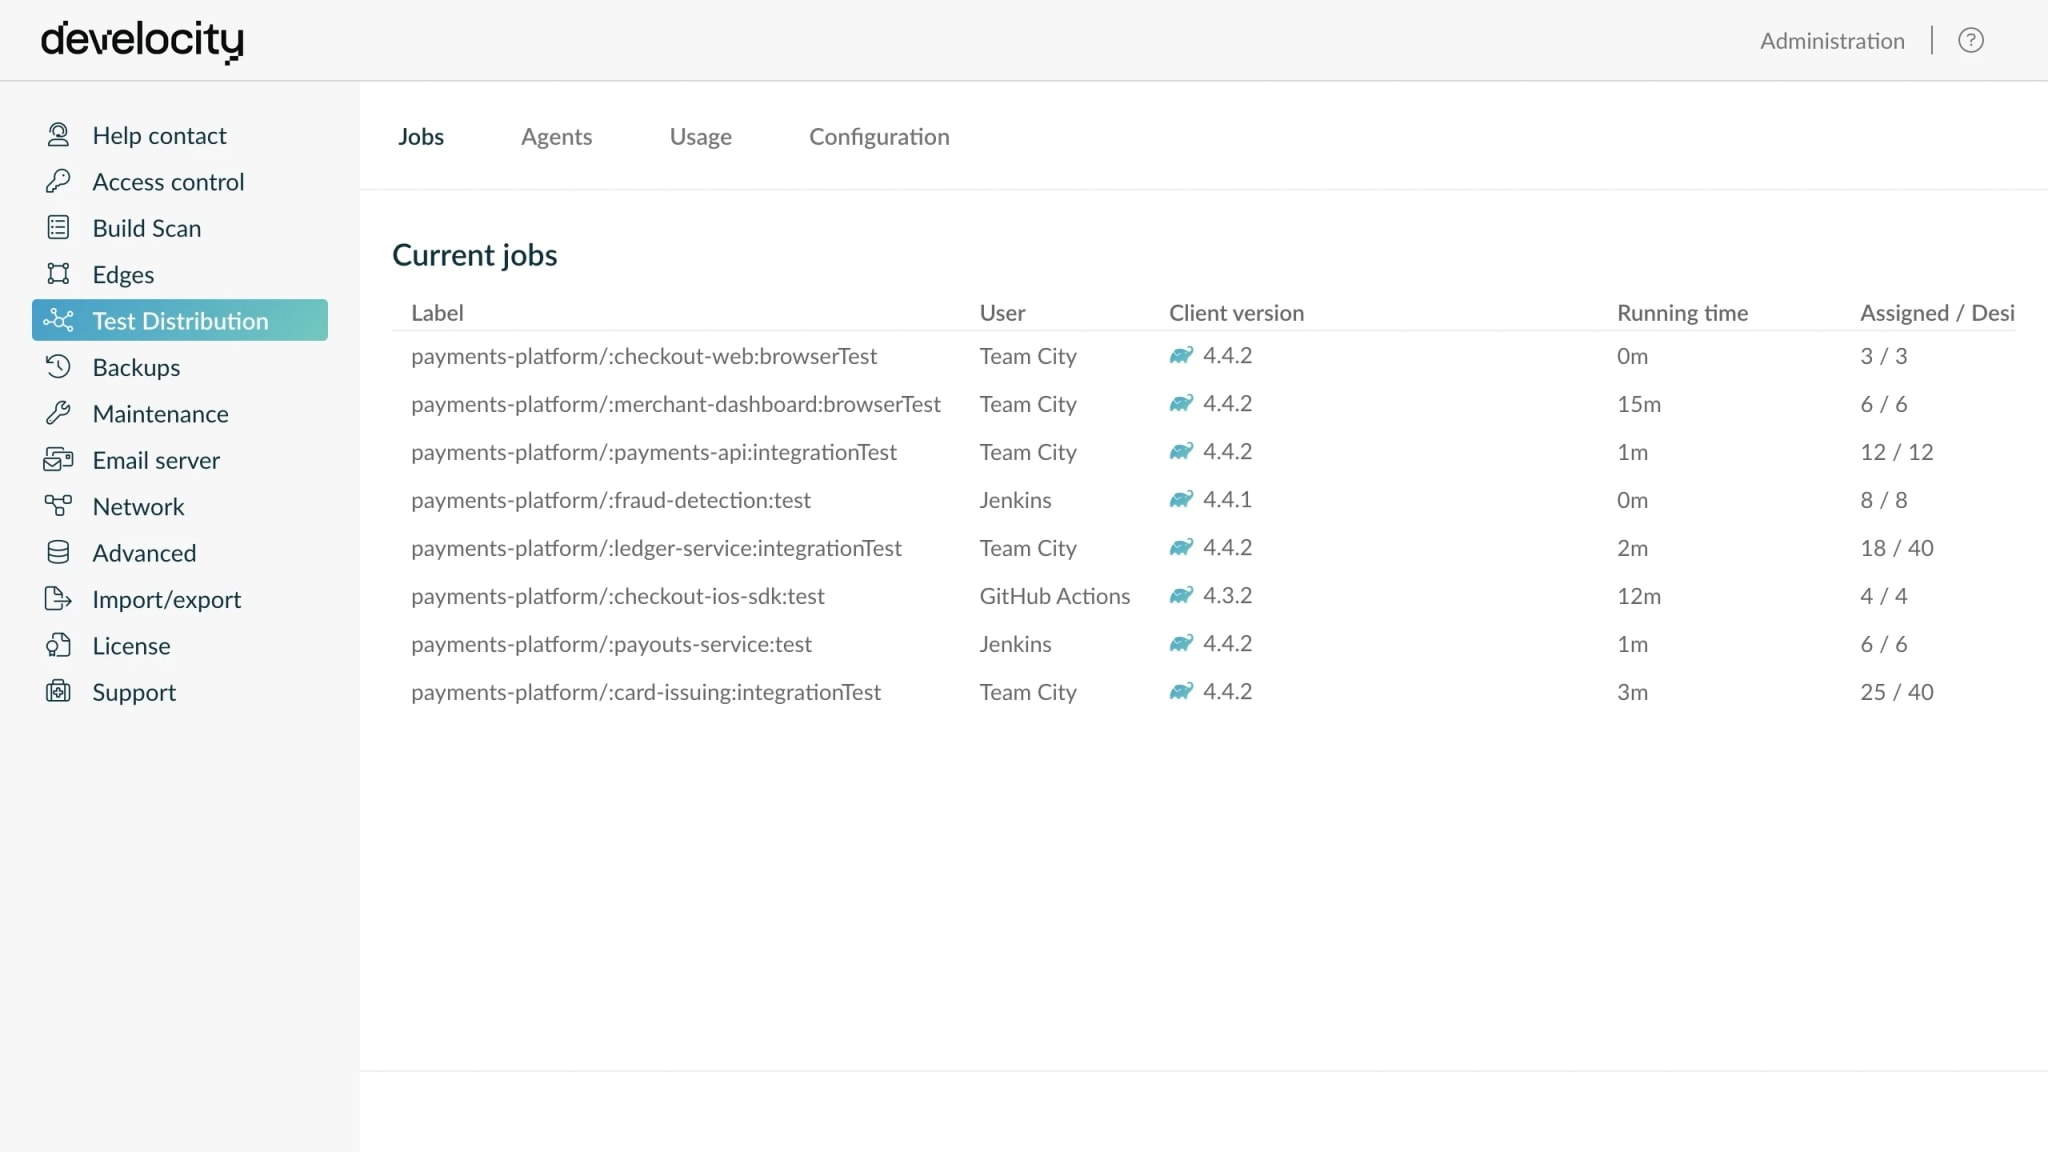
Develocity Test Distribution Jobs admin view showing concurrent jobs and their assigned-versus-desired agent counts.

Shared agent pools scaled to organizational demand

  • Teams draw from horizontally-scaled pools instead of each provisioning its own fixed capacity — utilization rises and idle hardware falls, on Kubernetes or EC2.
  • The broker routes each test only to agents advertising its required capabilities — operating system, JDK, native dependencies, custom tags like postgres=14 — so heterogeneous agent pools stay correct.
  • When demand outruns supply, the broker triggers agent pool autoscaling — bringing more agents online and releasing them when the spike passes.
Agent-pool usage charts for shared Linux and Windows pools, with a hovered point showing min and max size and agents utilized, desired, and connected.

One build, run the same way locally and in CI

  • The build compiles exactly once and distributes only the test classes. This eliminates the redundant compilation steps inherent to N-way CI fan-out jobs.
  • The same plugin configuration drives the local build on a developer's machine as the CI pipeline — every run delegates to the same shared agent pool.
  • Running the full suite locally and quickly before a PR shifts testing left — failures surface before pushing to CI.
  • AI agents rely on high-frequency build-test loops. Delegating each run's tests to the remote pool keeps the loop fast and the developer's machine free.
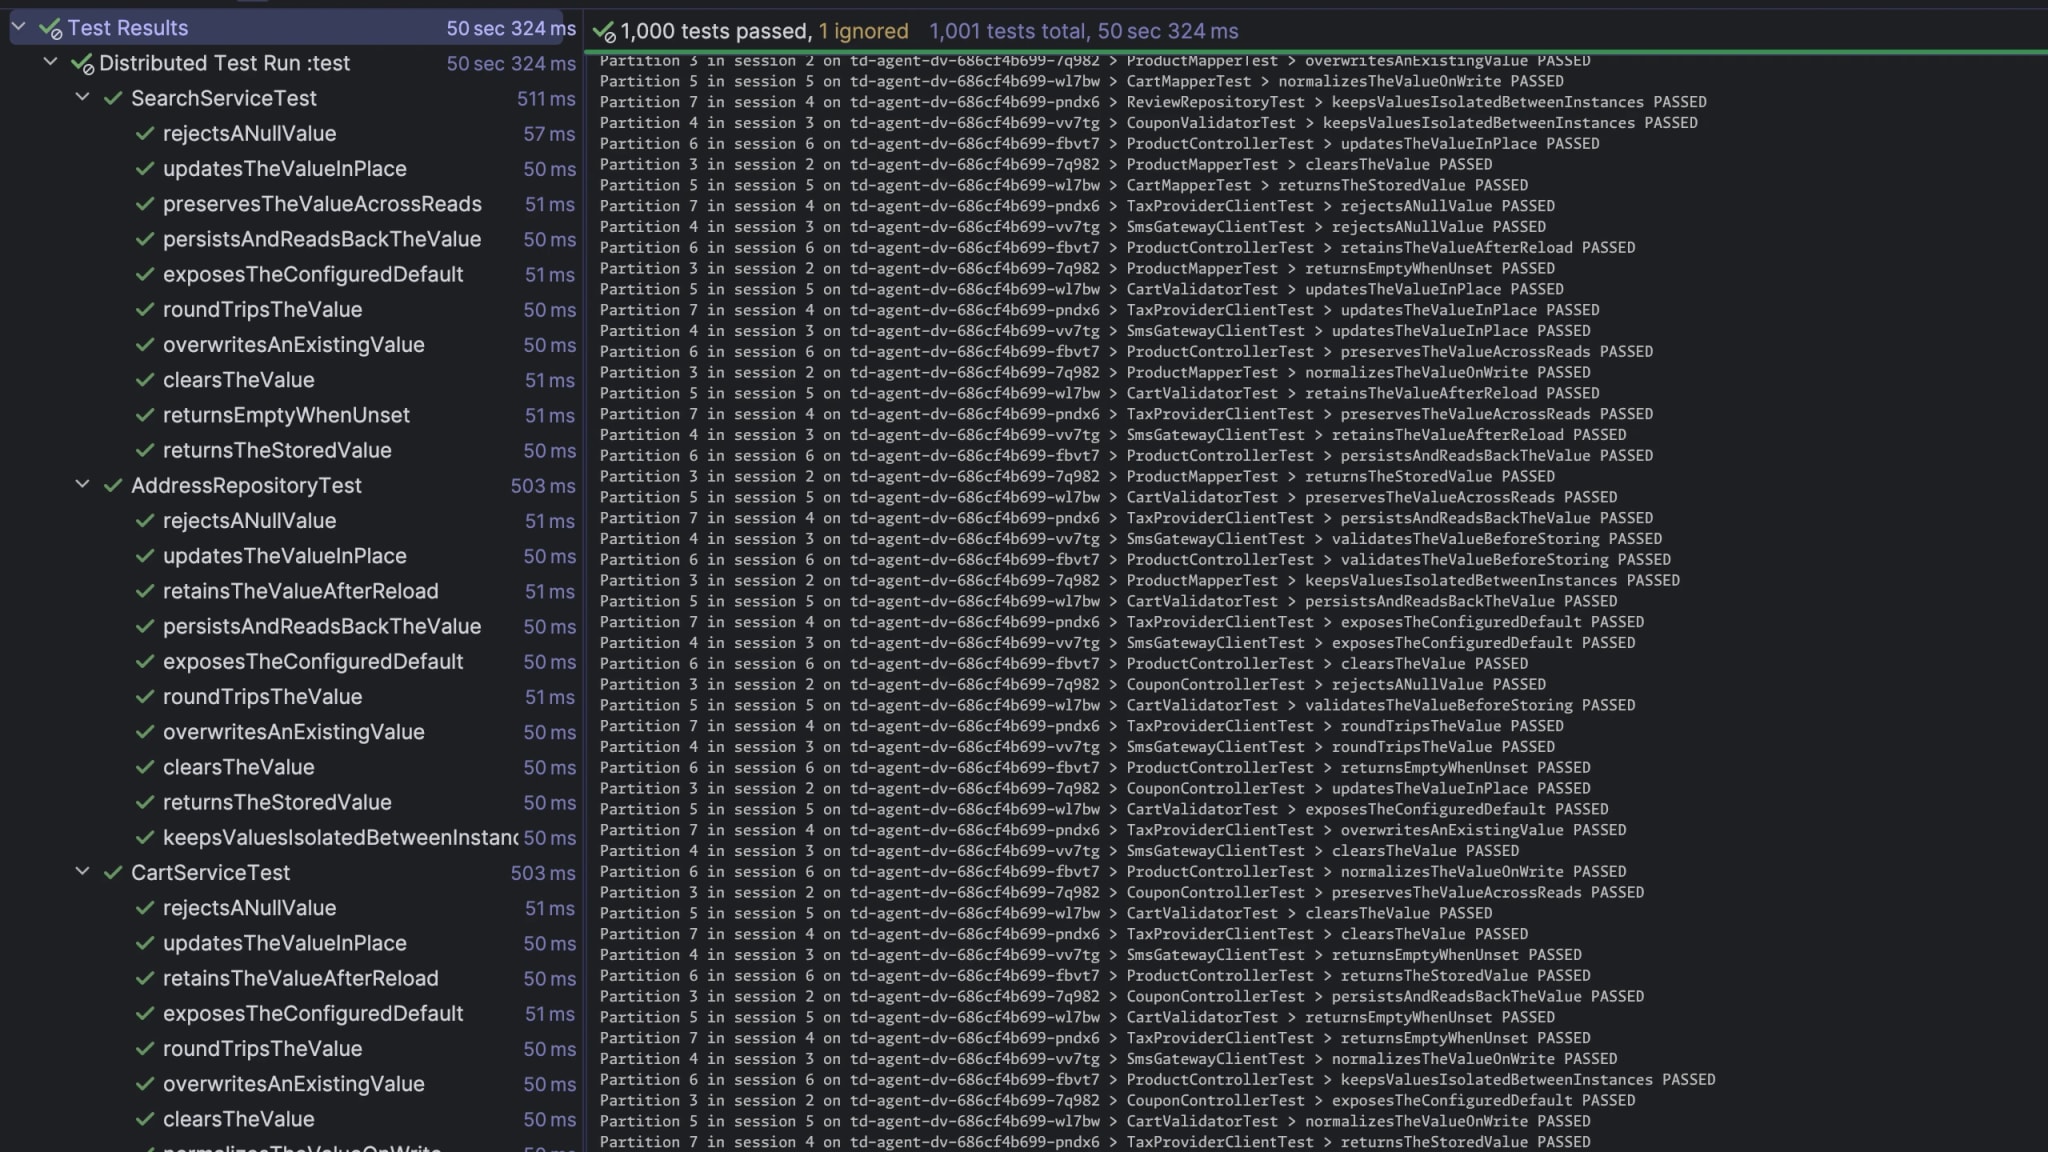
IntelliJ test results for a local test run distributed across remote agents — passing test classes in the tree, and a live log of test partitions running on multiple remote agents.
Observability

Every partition, agent, and test class attributed in the Build Scan

  • Every agent's results merge into one Build Scan — the unified view of a local run, with Test Distribution detail on top.
  • A timeline lays out each agent's run — the tests it ran and the time spent transferring files — so a lagging agent or heavy transfer stands out.
  • The Build Scan compares the agents a build asked for against the agents it got, so you can tell if the pool, not the tests, is the bottleneck.
Build Scan test-class view showing the remote executor and pool that ran it, with Test Distribution and Predictive Test Selection details.
Analytics

Track build time savings, and see where to roll out next

  • Dashboards show how much wall-clock time Test Distribution actually saved — by build tool, by project, and CI versus local.
  • See which projects have the longest test phases, and prioritize roll-out where test execution, not compile or deploy, dominates build time.
  • Develocity Analytics tracks savings by team and project over time, so if misconfigurations quietly erode savings, you can spot which project was impacted and fix it.
  • Ask any of it in plain language from an AI assistant through Develocity's MCP servers.
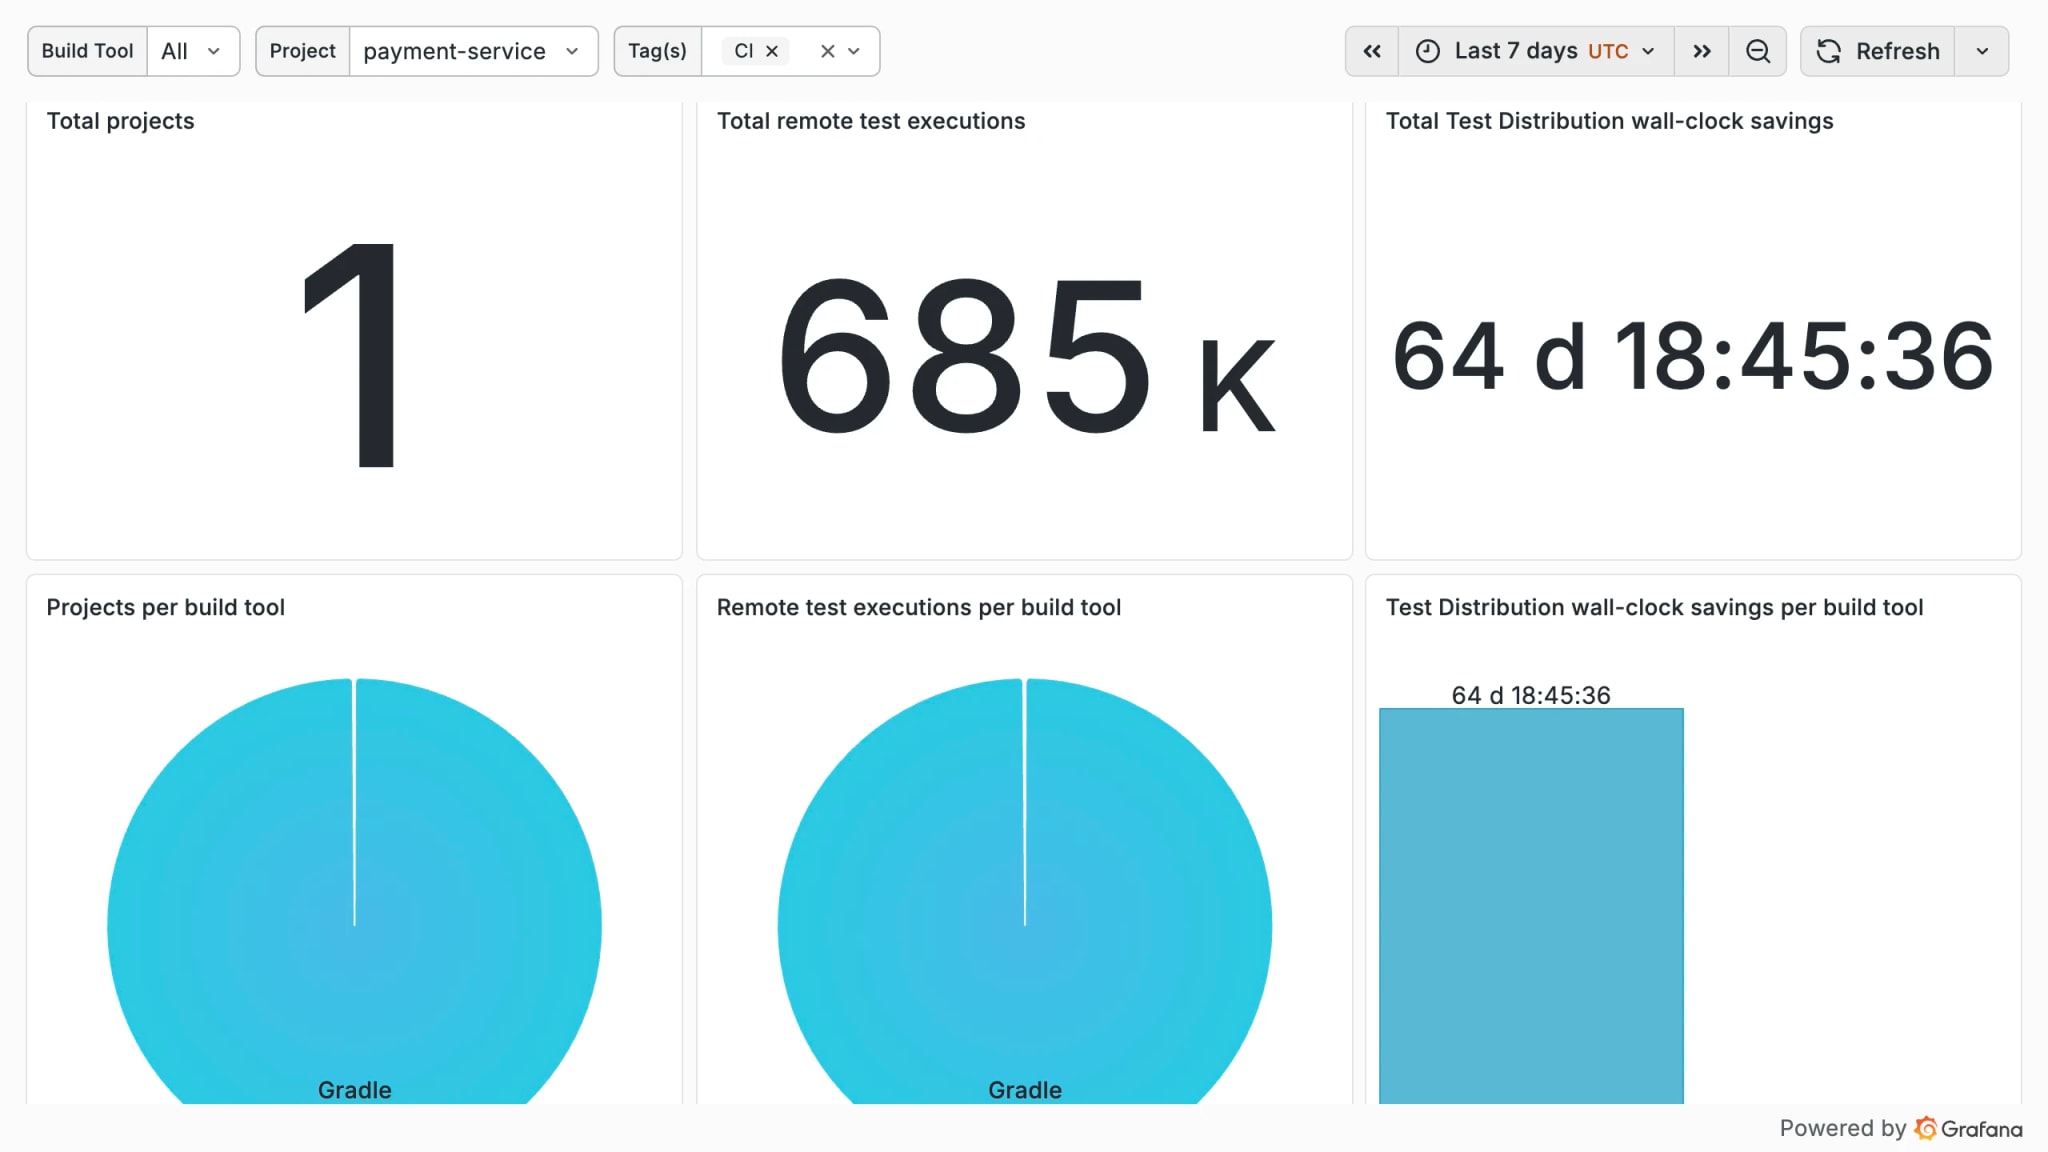
Test Distribution analytics dashboard showing remote test executions and total wall-clock savings broken down per build tool.

Resources

Netflix: hard DevProd metrics with Test Distribution (62 min to under 5 min)
Blog
HiveMQ: 3x faster feedback with Test Distribution
Case study
Test Distribution: an overview
Video
Test Distribution in action: a demo
Video

What's next

Get started today with a 30-day free trial of the entire Develocity product suite.

Start Free Trial

© 2026 Gradle, Inc. Gradle®, Develocity®, Build Scan®, and the Gradlephant logo are registered trademarks of Gradle, Inc.

Get an AI summary of Develocity: